This time I built a new FFT Visualizer Component.
It’s a split “FFT Plot”+”Waterfall” view, which has the “FFT Plot” in the top and the waterfall in the bottom half.
In the video (watch fullscreen in HD mode) you cannot see the dB markers very clearly.
These are on the left and the right border of the “FFT Plot” (top part) and labelled in 50dB steps.
The “Waterfall” has a configurable upper and lower dB limit (changed with mouse wheel, see lower left corner).
Values above the upper limit are drawn cyan, those with a dB value lower than the lower limit are drawn black.
The values between are colored with a color between.
Here a video of that component:
Related Posts
ESP32 / Kenwood XS8/SL16 Remote
This is just a quite short and incomplete article, compared...
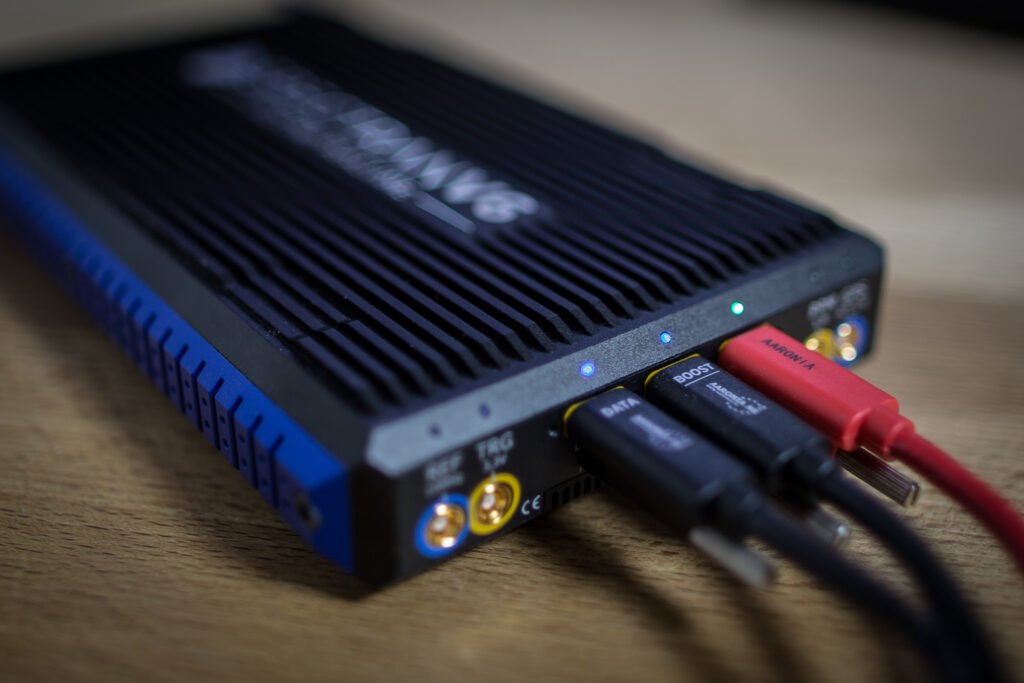
GSM Analyzer – Support for Aaronia RTSA / Spectran V6
Before I go into GSM Analyzer details a few words...
[blog] revived again
Its holiday time and i thought it’s time to revive...