Since the war in Ukraine, the discussion about nuclear weapons raised and people got into thinking about radioactive exposure again. While there is no real fear, there is still some awareness and interest in the normal radiation levels you have around you all the time.
Every now and then you see a geiger counter project popping up in the web. Most of them look very solid and share their design files. However the least of them provide the measurements via WiFi. There are some, most of them not SMD but THT and thus are not very compact.
This was the starting point for a discussion with a friend and the journey of creating our own design.
But what do we need for an adequate geiger counter?
First of all: RGB LEDs!
No, just kidding. Of course the LEDs play some role in this design, but it’s certainly not the most important thing here.
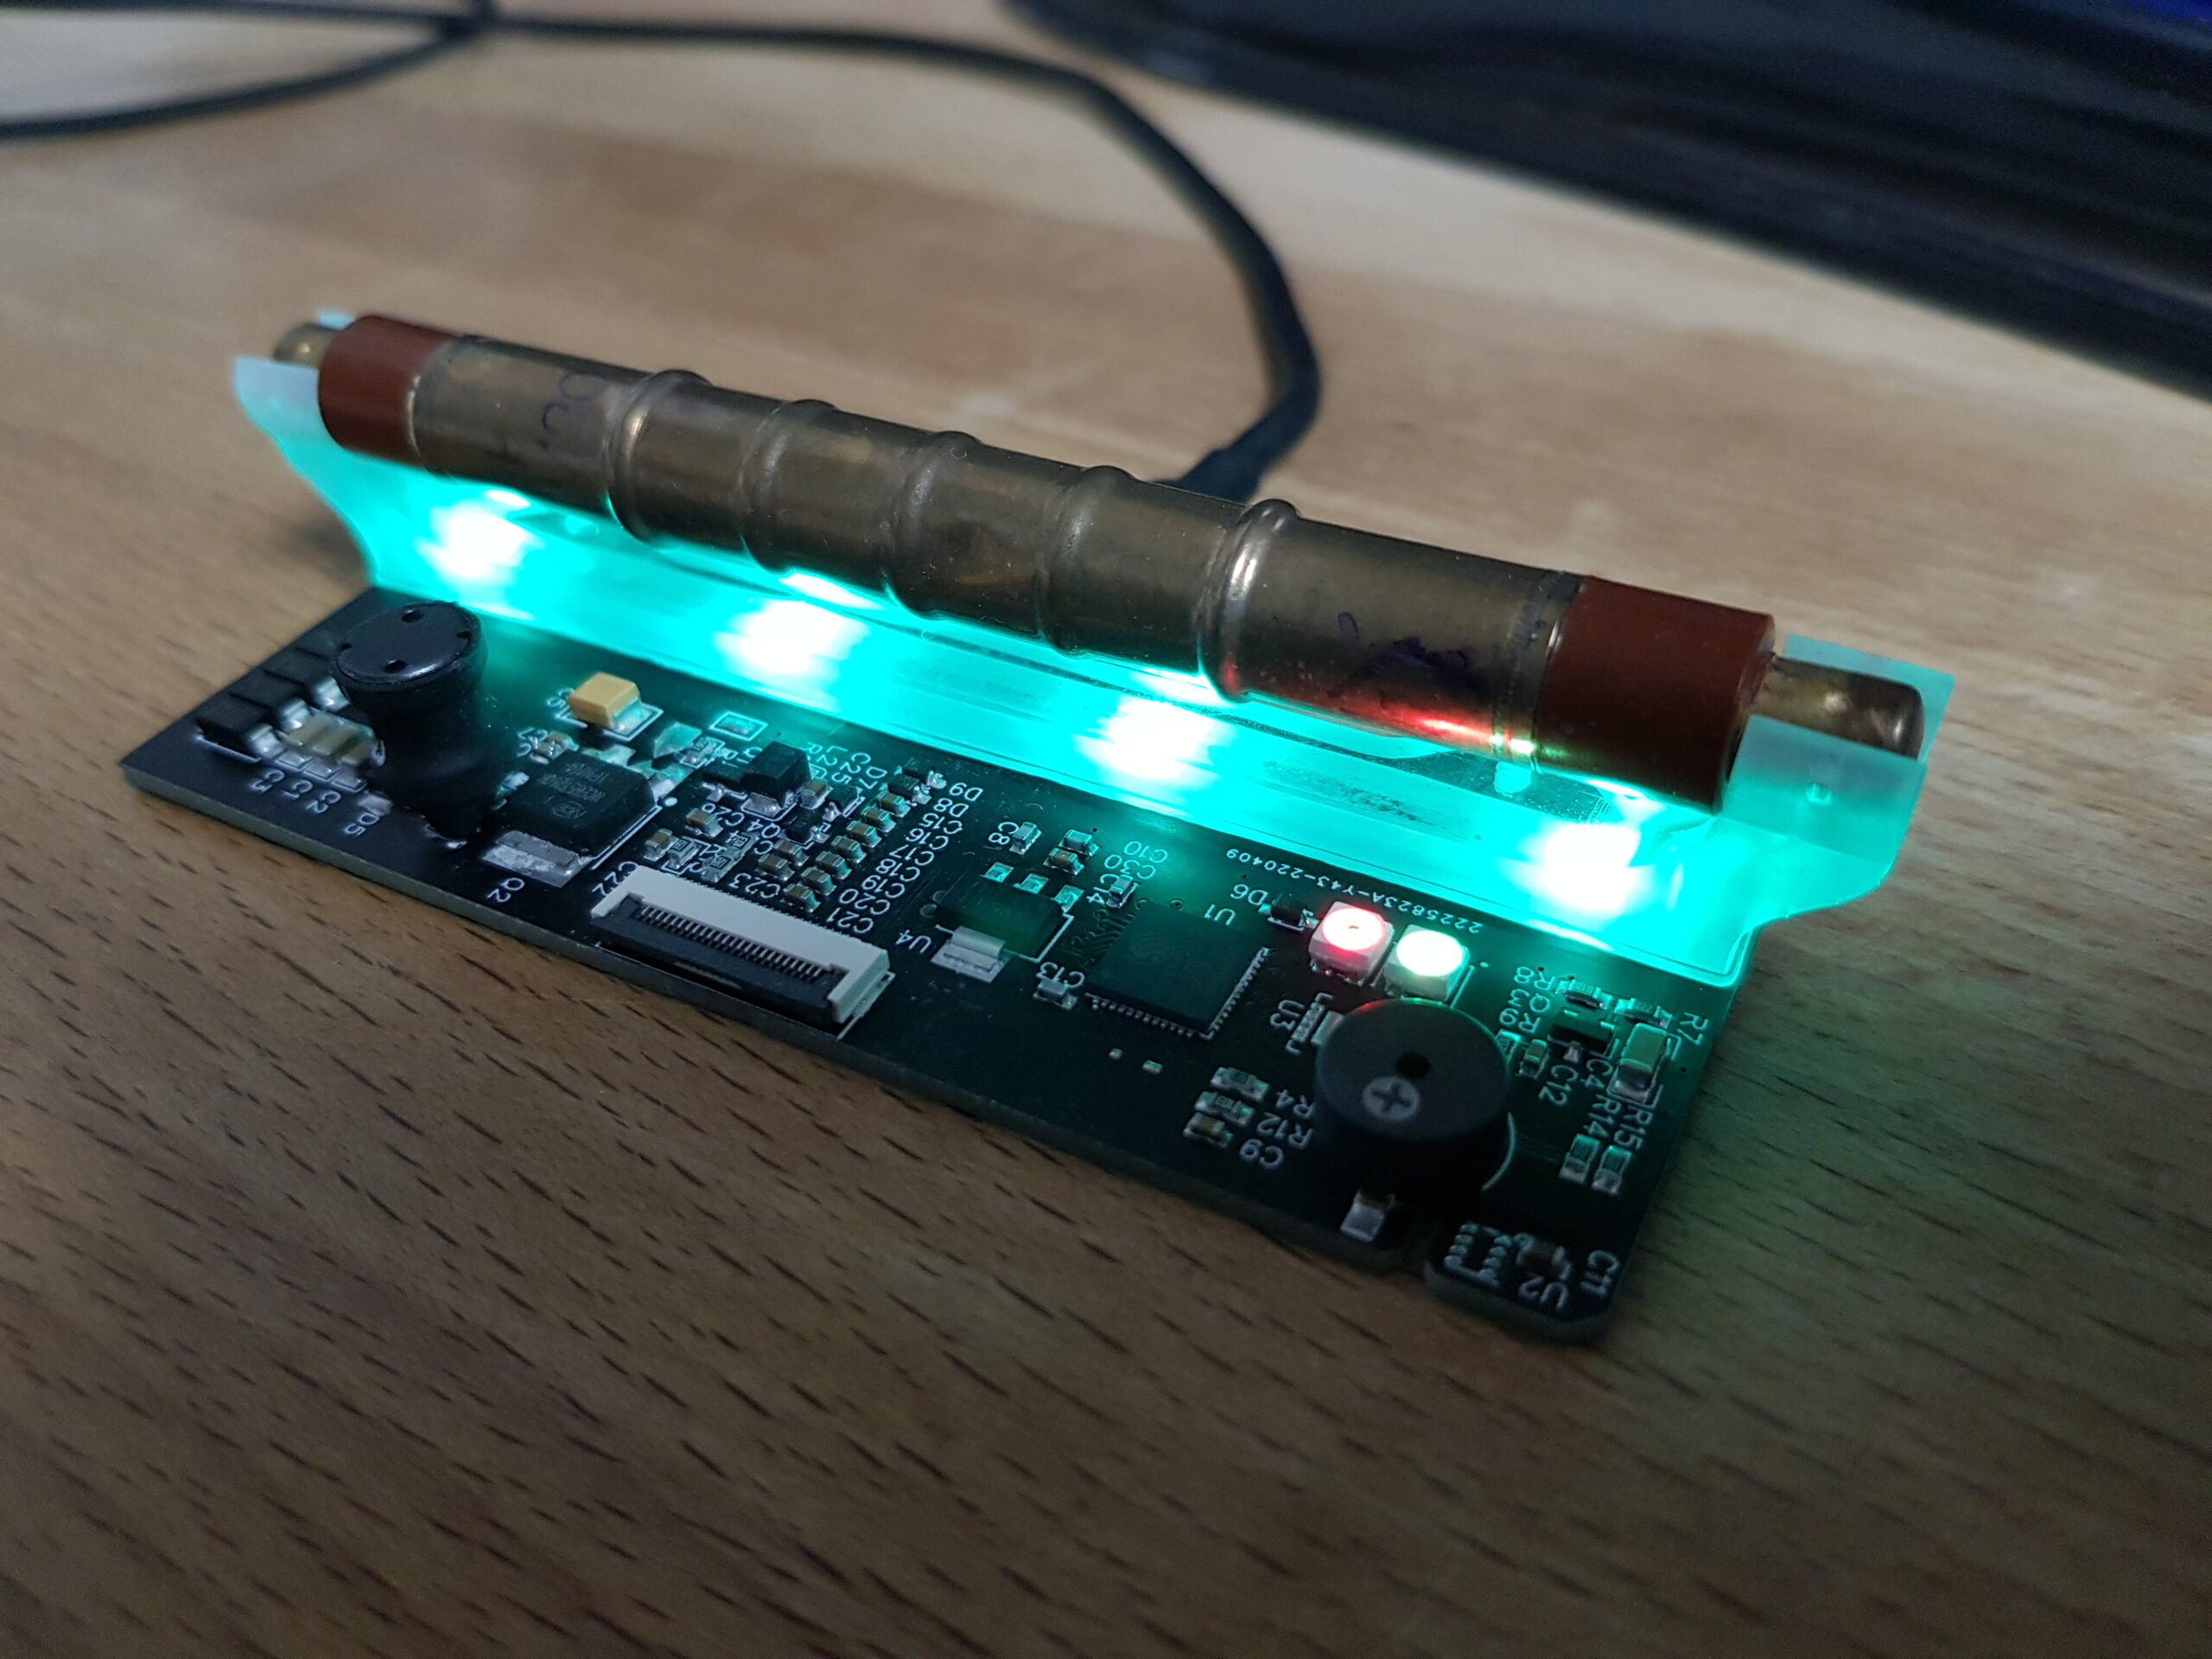
We need a few WS2812 for creating some decent ambient lighting. Not just that, but also for signalling the current radiation level via its color.
When idle, the geiger tube shall glow in a decent green – or maybe cyan? You decide on your own, thanks to the RGB LEDs. When elevating a certain level, a warningly red glow signals something that hopefully won’t happen.
Also: Every count they shall light up with a bright white flash, to notify about beta particles or gamma rays passing through your tube.
That’s all great for the visual effects when showing off the counter, but will get a bit annoying if it is placed somewhere in the living room. So all of that must be configurable, down to making it dead dark.
The detector
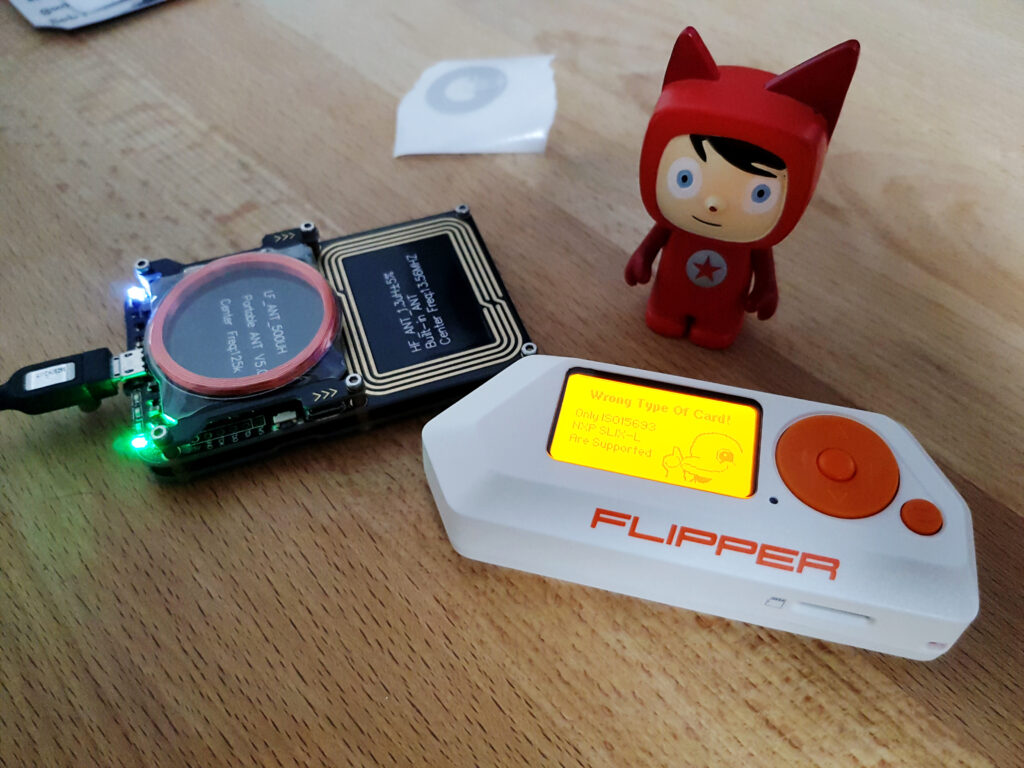
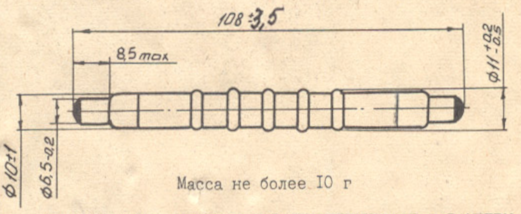
There are various types of tubes which you might want to use in that kind of project. The most common tube is the SBM-20 which you can get for around 20-25 € on ebay. A great alternative would be the SBM-19, which is much more sensitive but also larger and a bit more expensive at around 40 €. Lately the prices went up, probably as the main sellers are located in ukraine or bulgaria.
I ordered SBM-20’s from both countries and both arrived, just the ukrainian one being a few weeks later. I initially didn’t notice that the seller was from ukraine and – to be honest – did not expect to arrive at all when I realized that. Great respect for the seller. Stay safe over there!
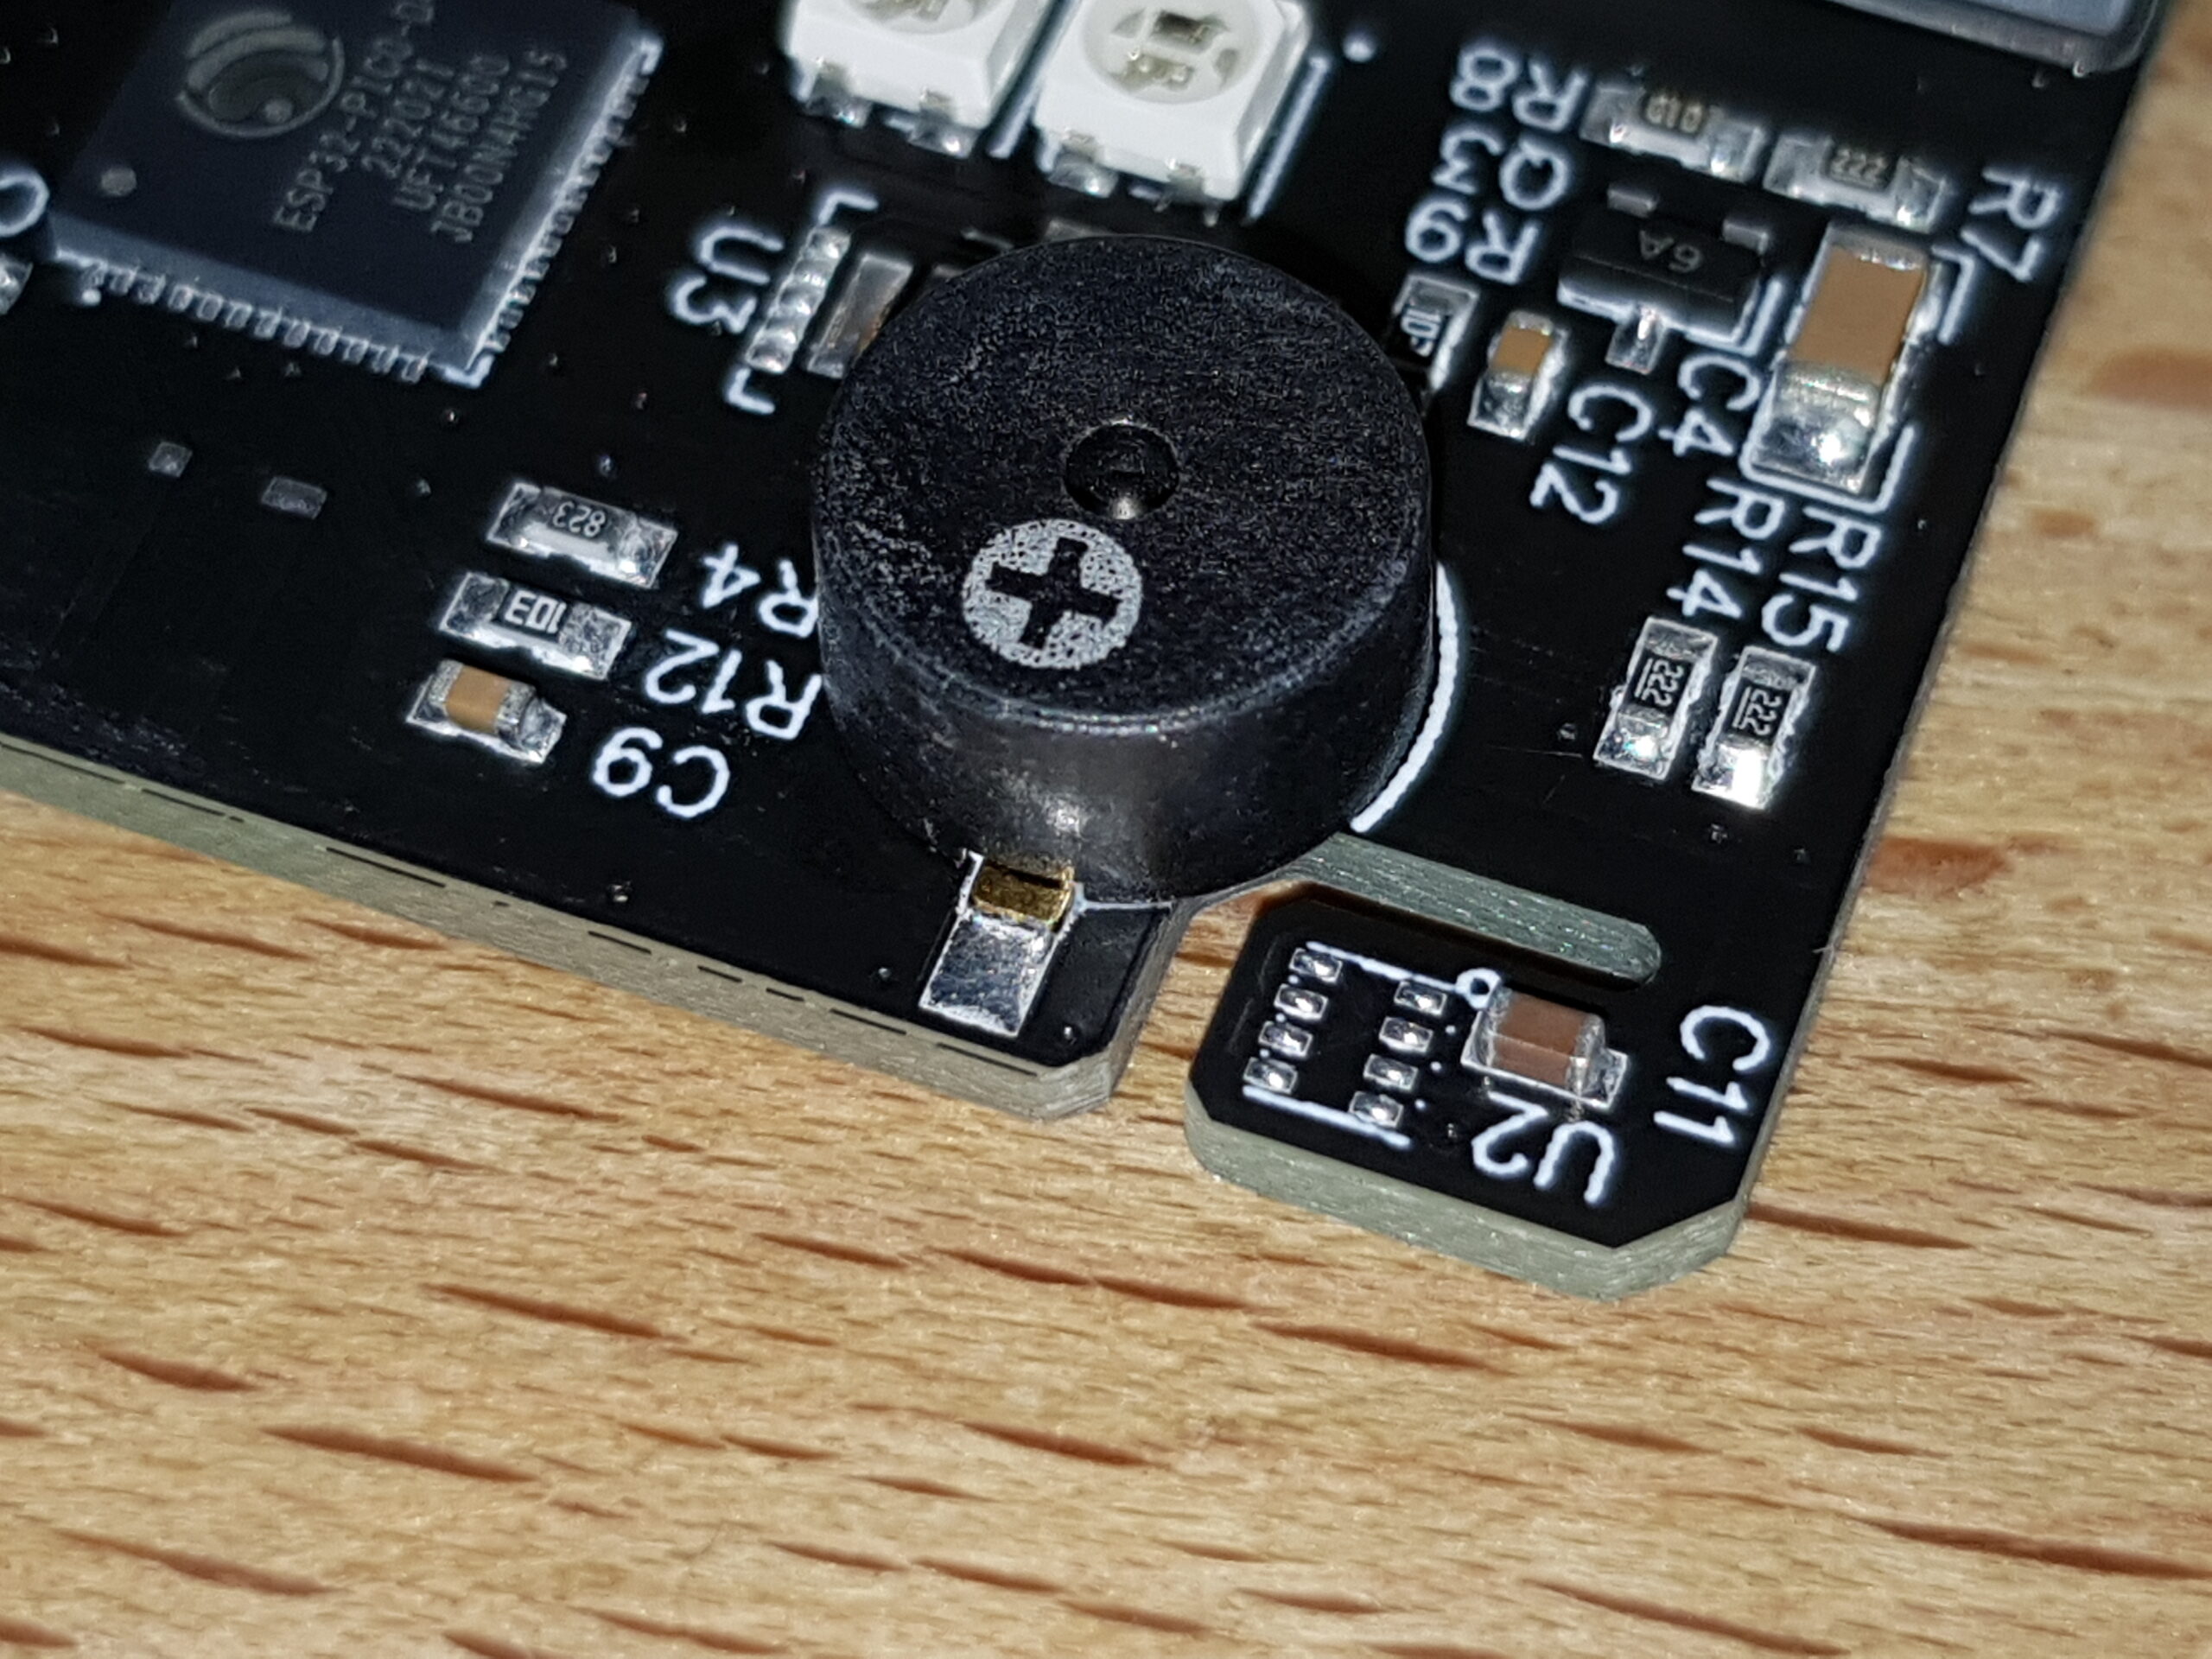
The heart: ESP32-PICO-D4
This is the far more important item. The brain is some proper state-of-the-art WiFi microcontroller with great bang-for-buck ratio. The ESP32 itself is already a nice piece, but the required external components makes you usually chose the WROVER or WROOM modules. While these are great and cheap, they still require precious PCB space.
For a while now, Espressif have their PICO series, which is the well-known ESP32 in a slightly bigger QFN48 7x7mm package, but with all required components integrated: The ESP32 core, a SPI flash chip and a crystal. So you just need the voltage supply and you’re ready to launch.
What does the ESP32 do in this design?
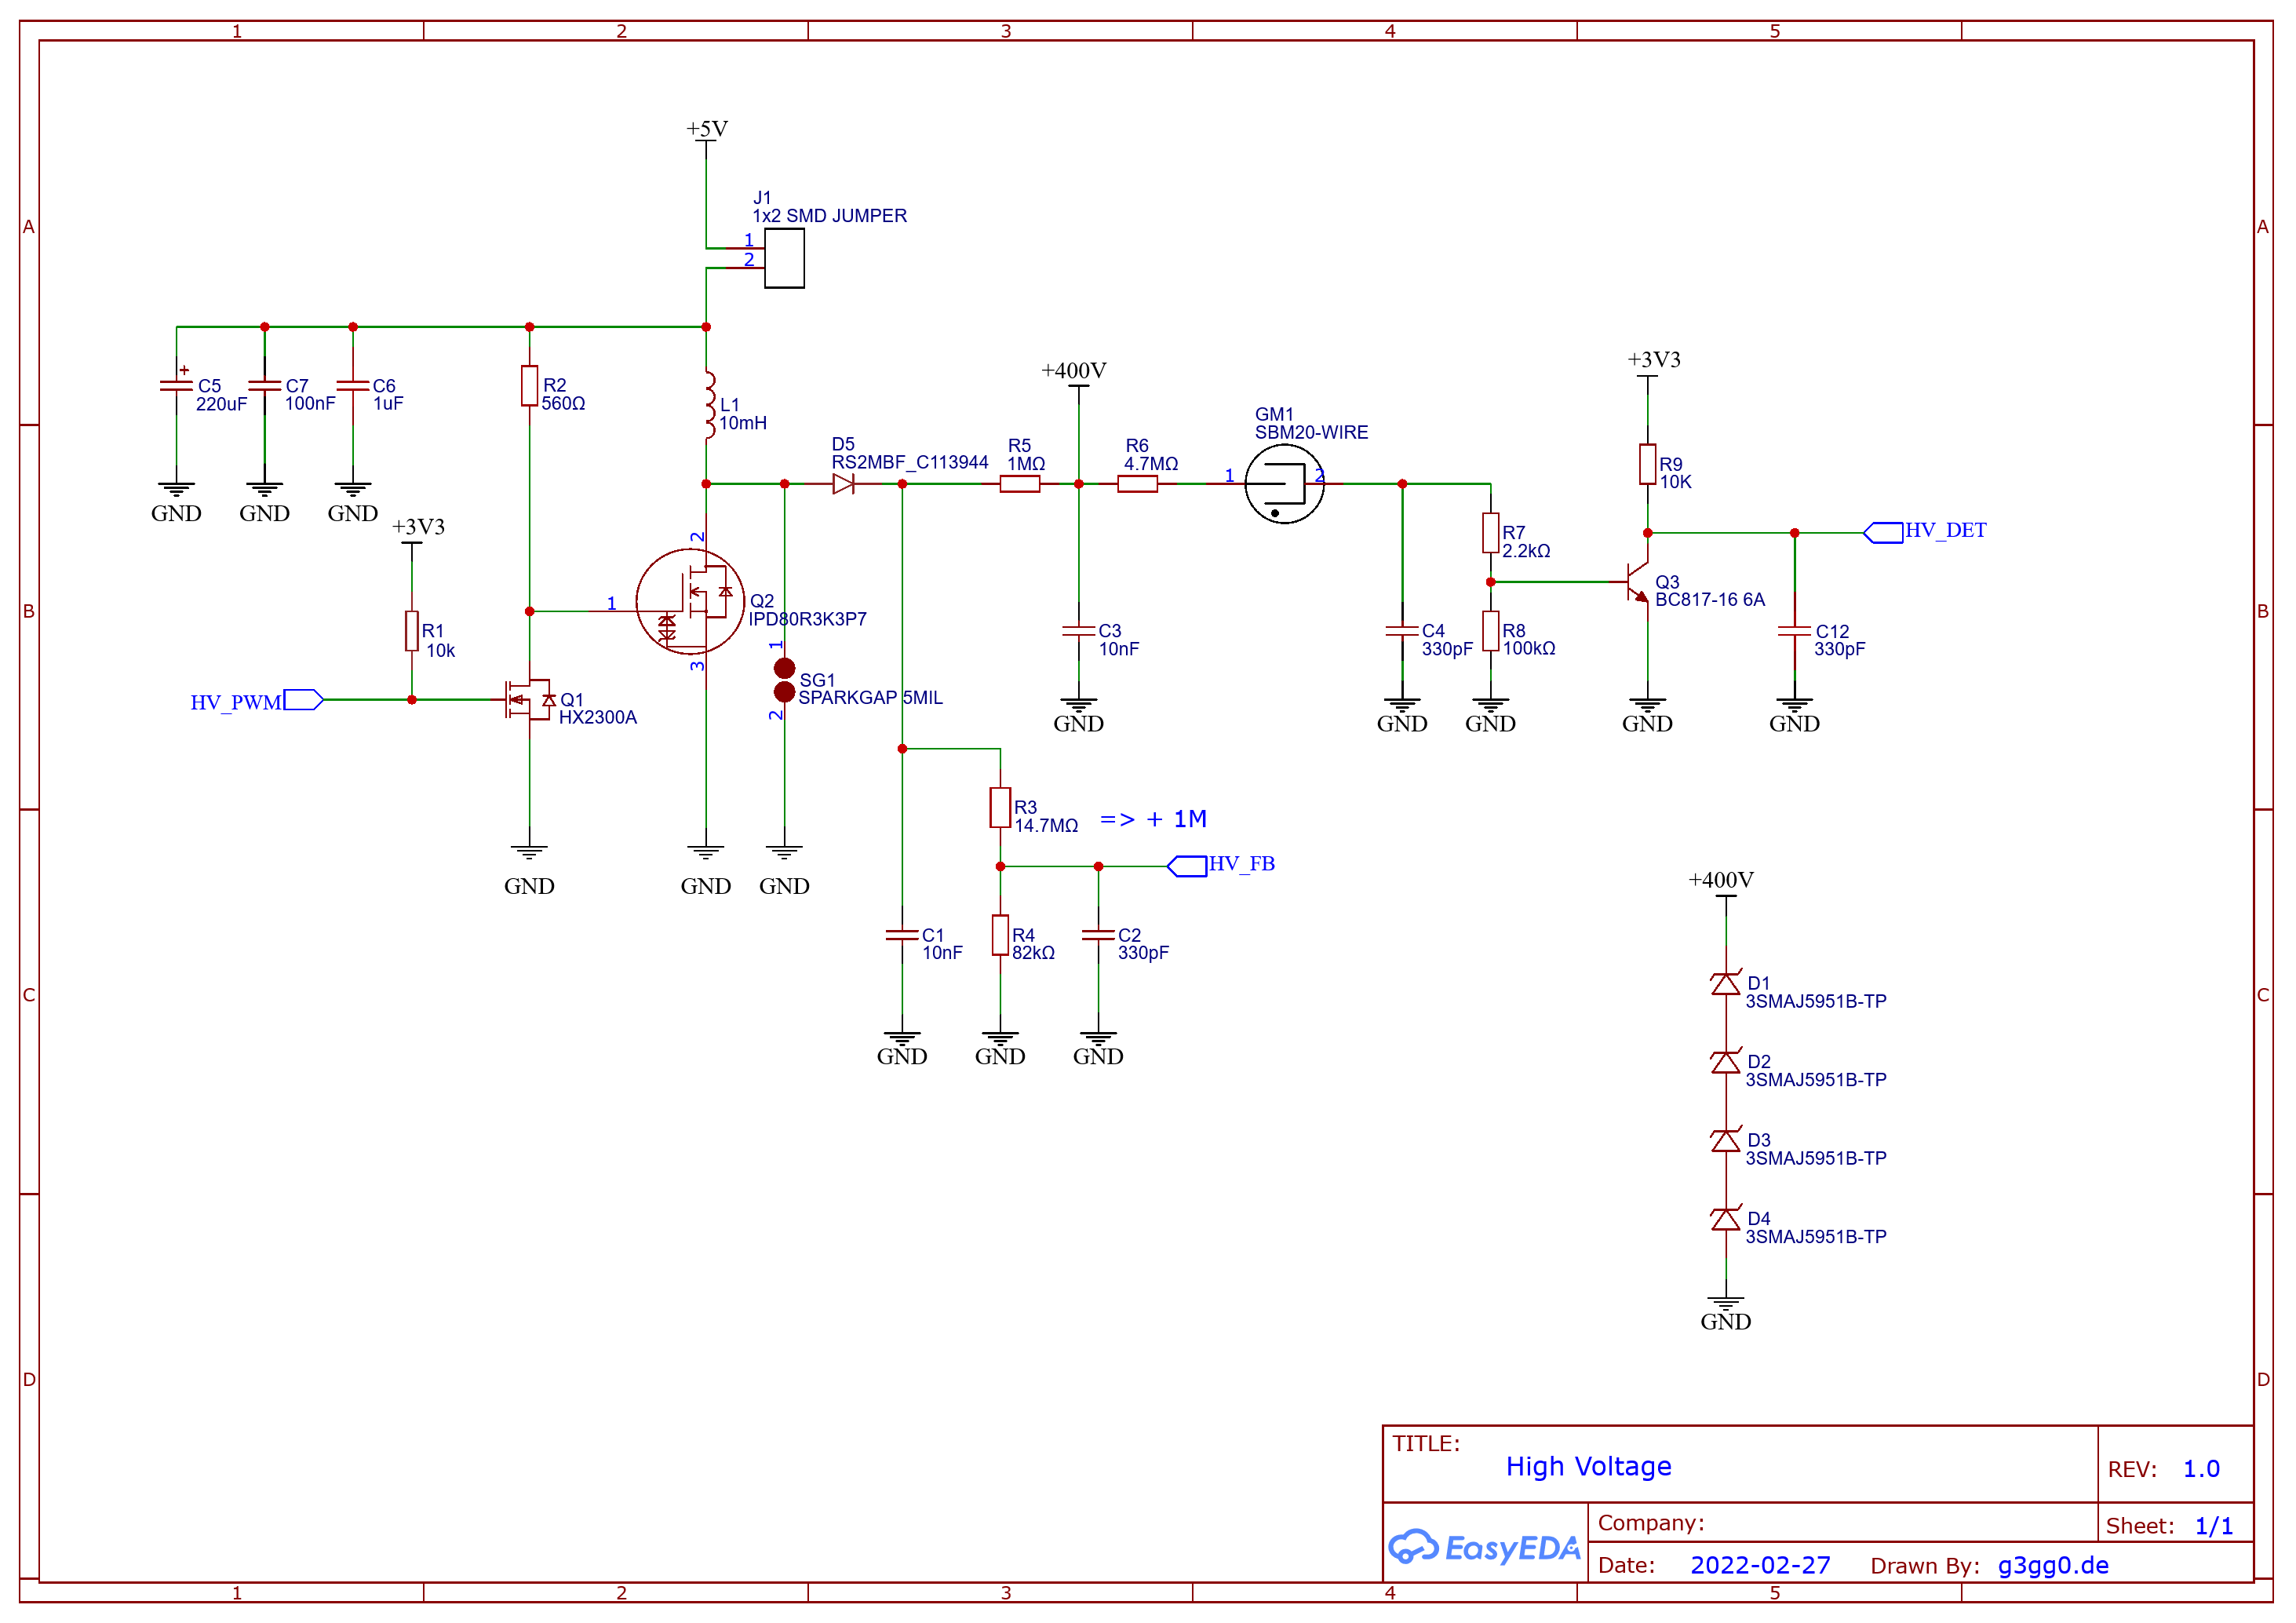
One task is to generate the PWM signal required for generating the high voltage. This is accomplished with a simple boost circuit, consisting of a 650 V N-Channel MOSFET, an inductor with 10 mH and a diode. Goal was to have a fully SMD design except the geiger müller tube. However the available inductors with 10 mH in SMD package have a quite high resistance somewhere in the 100 ? ballpark, while the THT ones just have around 30 ? or even less. This greatly impacts the efficiency of the generator.
With a lot of experimenting, I was able to get around 400 V with 10 mH at around 20 kHz and high duty cycles, but it was highly unstable, varying with temperature and jumping around. Also the operation at this frequency and duty cycle caused a lot of heat. Using the 100 ?, 10 mH SMD inductor wasn’t going well either. So I sticked to a 2 ?, 1 mH THT part here, for the sake of a stable voltage and less heat. The voltage was stable and could even go up a bit higher than needed.
Edit: Seems I got some notes wrong regarding the inductor values, will update the values and insert proper graphs.
Detailed plots – Voltage / Frequency / Duty cycle [Update 02.09.2022]
As it was not possible to implement a current regulator in software due to some discontinuities, I wanted to plot out where the sweet spots for the HV controller would be. So I set up my Keithley to measure the HV generation current and the Geiger counter measured its voltage via an ADC pin.
The values were gathered using a C# commandline tool and visualized using ScottPlot.
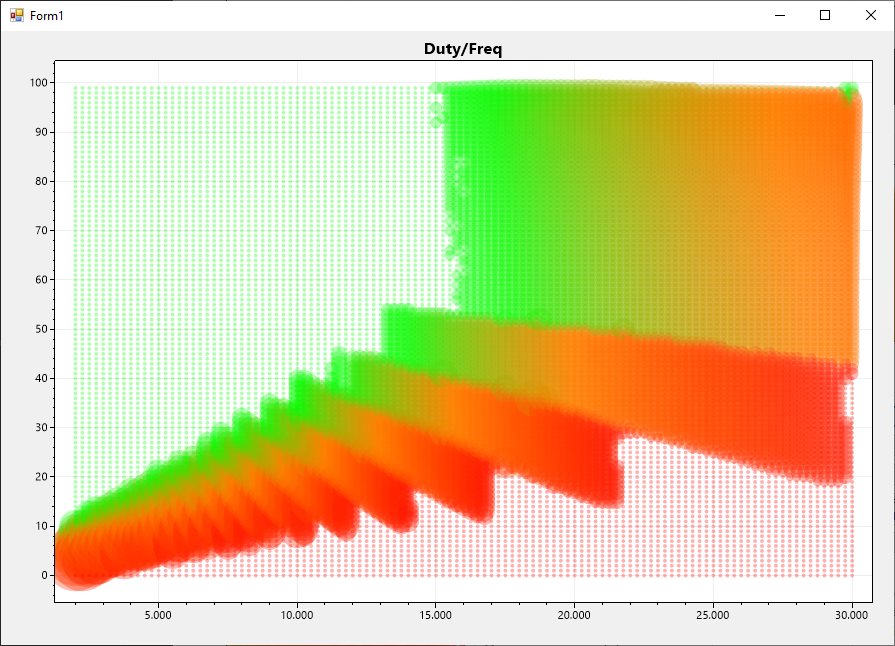
The graph above shows 2 parameters and 2 measurements. The plot shows the frequency on the X axis and the duty cycle on the Y axis. The measured voltage is shown as color – the fully saturated green is 550 V, the fully saturated red stands for 50 V. The top left area is “beyond 550 V” whereas the bottom right is “belov 50V”.
The second measurement is the operating current. It is mostly between 8.8 mA and 16 mA. The 8.8 mA is due to a pull up on the MOSFET’s gate which I want to optimize away. Depending on duty cycle and the voltage, I calculated a ratio V / mA which is compensated for the pull-up current.
This ratio was used to set the bubble sizes.
However it’s best to ignore the bubble sizes for now, just to look out for “spots” where a voltage controller has a linear field to regulate on.
In v3.2 I switched to Infineon MOSFETs, which lead to a different different plot for the same inductor.
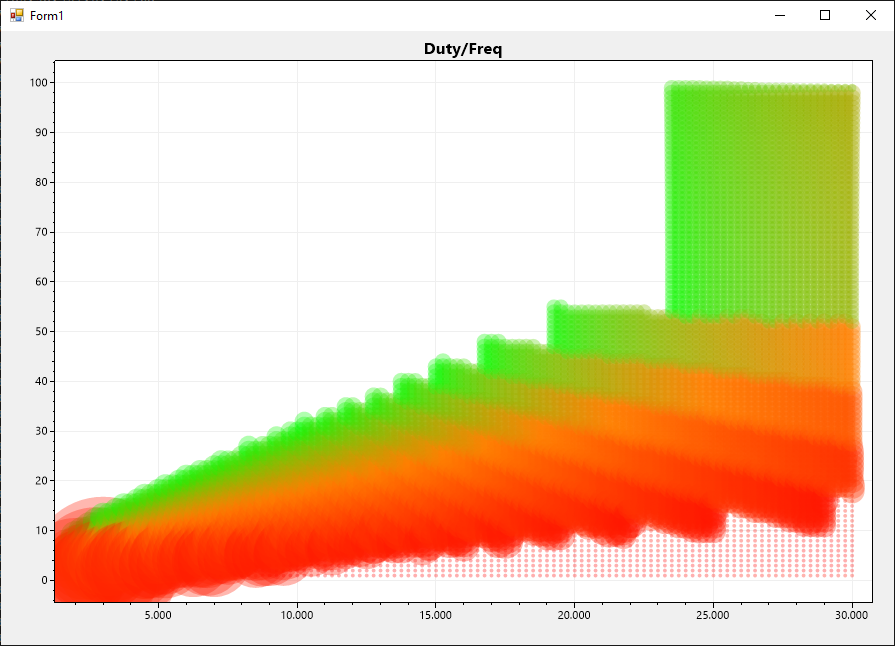
With the Infineon MOSFET, the voltage at lower frequencies is a lot higher compared to the previous MOSFET. I guess this is due to lower RDS_on with a 5 V gate voltage, causing a higher efficiency. This means that I would have to choose around 28 kHz with 80 % duty cycle to get the desired 400 V.
High voltage feedback
The ESP32 also measures that voltage via a feedback line, which gets divided down to match the ADC’s reference voltage. To have some headroom, the dividers were set to a maximum voltage of ~550 V. As dividing down this high voltage for the 1.1 V ADC reference voltage feeled a bit weird, I have set VDDA to 3.3 V.
Hovever the 14.7 M? in the feedback divider would cause a current of ~27 µA at 400 V and unfortunately under these circumstances, the effective resistance drops down to ~13.8 M?, causing a higher current accordingly. This causes the voltage divider to shift a few percent. Not sure where this effect comes from, but it was also measurable with my Keithley SourceMeter 2400. Just configure the ohms measurement to 210 V and select a current of a few µA and the calculated resistance drops. For sure there is some proper explanation, if you know please tell me.
Edit: Hackaday users pointed out that the electric field across that single resistor is far too high, causing that effect. Still not certain what the physical reason is, however I made a fix in v3.2 of the PCB. Now I can populate two 0603 resistors in series for the ~14 M?.
Fortunately setting a frequency and duty cycle causes a quite stable voltage across all temperatures I tried. So right now there is no real voltage controller implementation. Would have to check how the on/off phase durations and the frequency play together.
As you also can see in the schematic, there are some angst-parts for the first experiments – especially the zener diodes on the right part. Ignore the giant spark gap, its a leftover from some experiments with high inductance coils. Wanted to test if I can omit the zener diodes.
Another job is to monitor count events. This is definitely not a complex task for such a microcontroller. Either configure the input to raise an interrupt on level change and within the interrupt handler count up a integer variable or use the dedicated peripheral PCNT for this task. In this case I chose the CPU interrupt variant of which I knew it worked. Using PCNT is definitely the recommended solution.
E-Paper Display
This geiger shall not only blink and click, but also show some statistics on a fancy e-paper display (electrophoretic display, EPD). The first prototype was with some sharp memory LCD display, but soon we decided to use the common “GoodDisplay” 24 pin real EPDs.
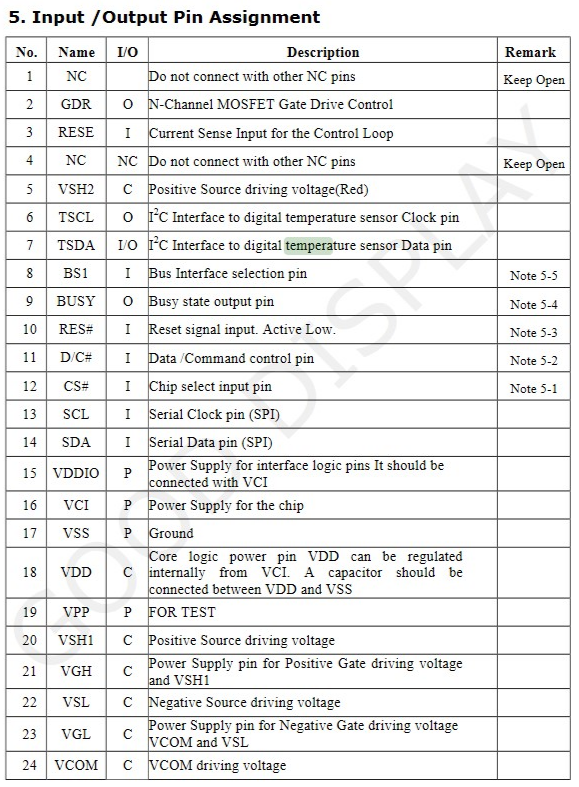
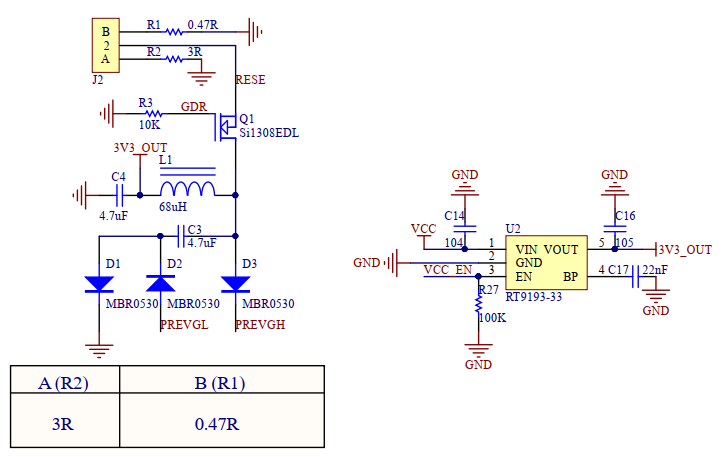
There are different sizes and colors (BW, BWR or BWY) but all have a common pinout, just differing in a current sense resistor at RESE.
When drawing the circuit, I made an annoying mistake, having a 10 k? resistor in series to the GDR line for the step up MOSFET (Q1) gate. This happened because I made that part late at night, while watching an episode of some netflix series. Yeah call me inflexible and begging for design guidelines, but for me pull-downs are going down, pull-ups go up to the supply rails, inputs are coming from the left, and the outputs tend to go right. Of course you cannot guarantee this layout at all times, as part symbols also have outputs to the left or from the bottom etc. But just labelling a wire, and having ground from the left and even from above is just an annoying and error-prone practice.
However, I didn’t notice my fault here, even during review and thus debugging and workarounds were required before getting the display to work. Having a 10 k? on a gate is definitely something that should have triggered my scepticism. Maybe I should focus more on the schematics without watching netflix :)
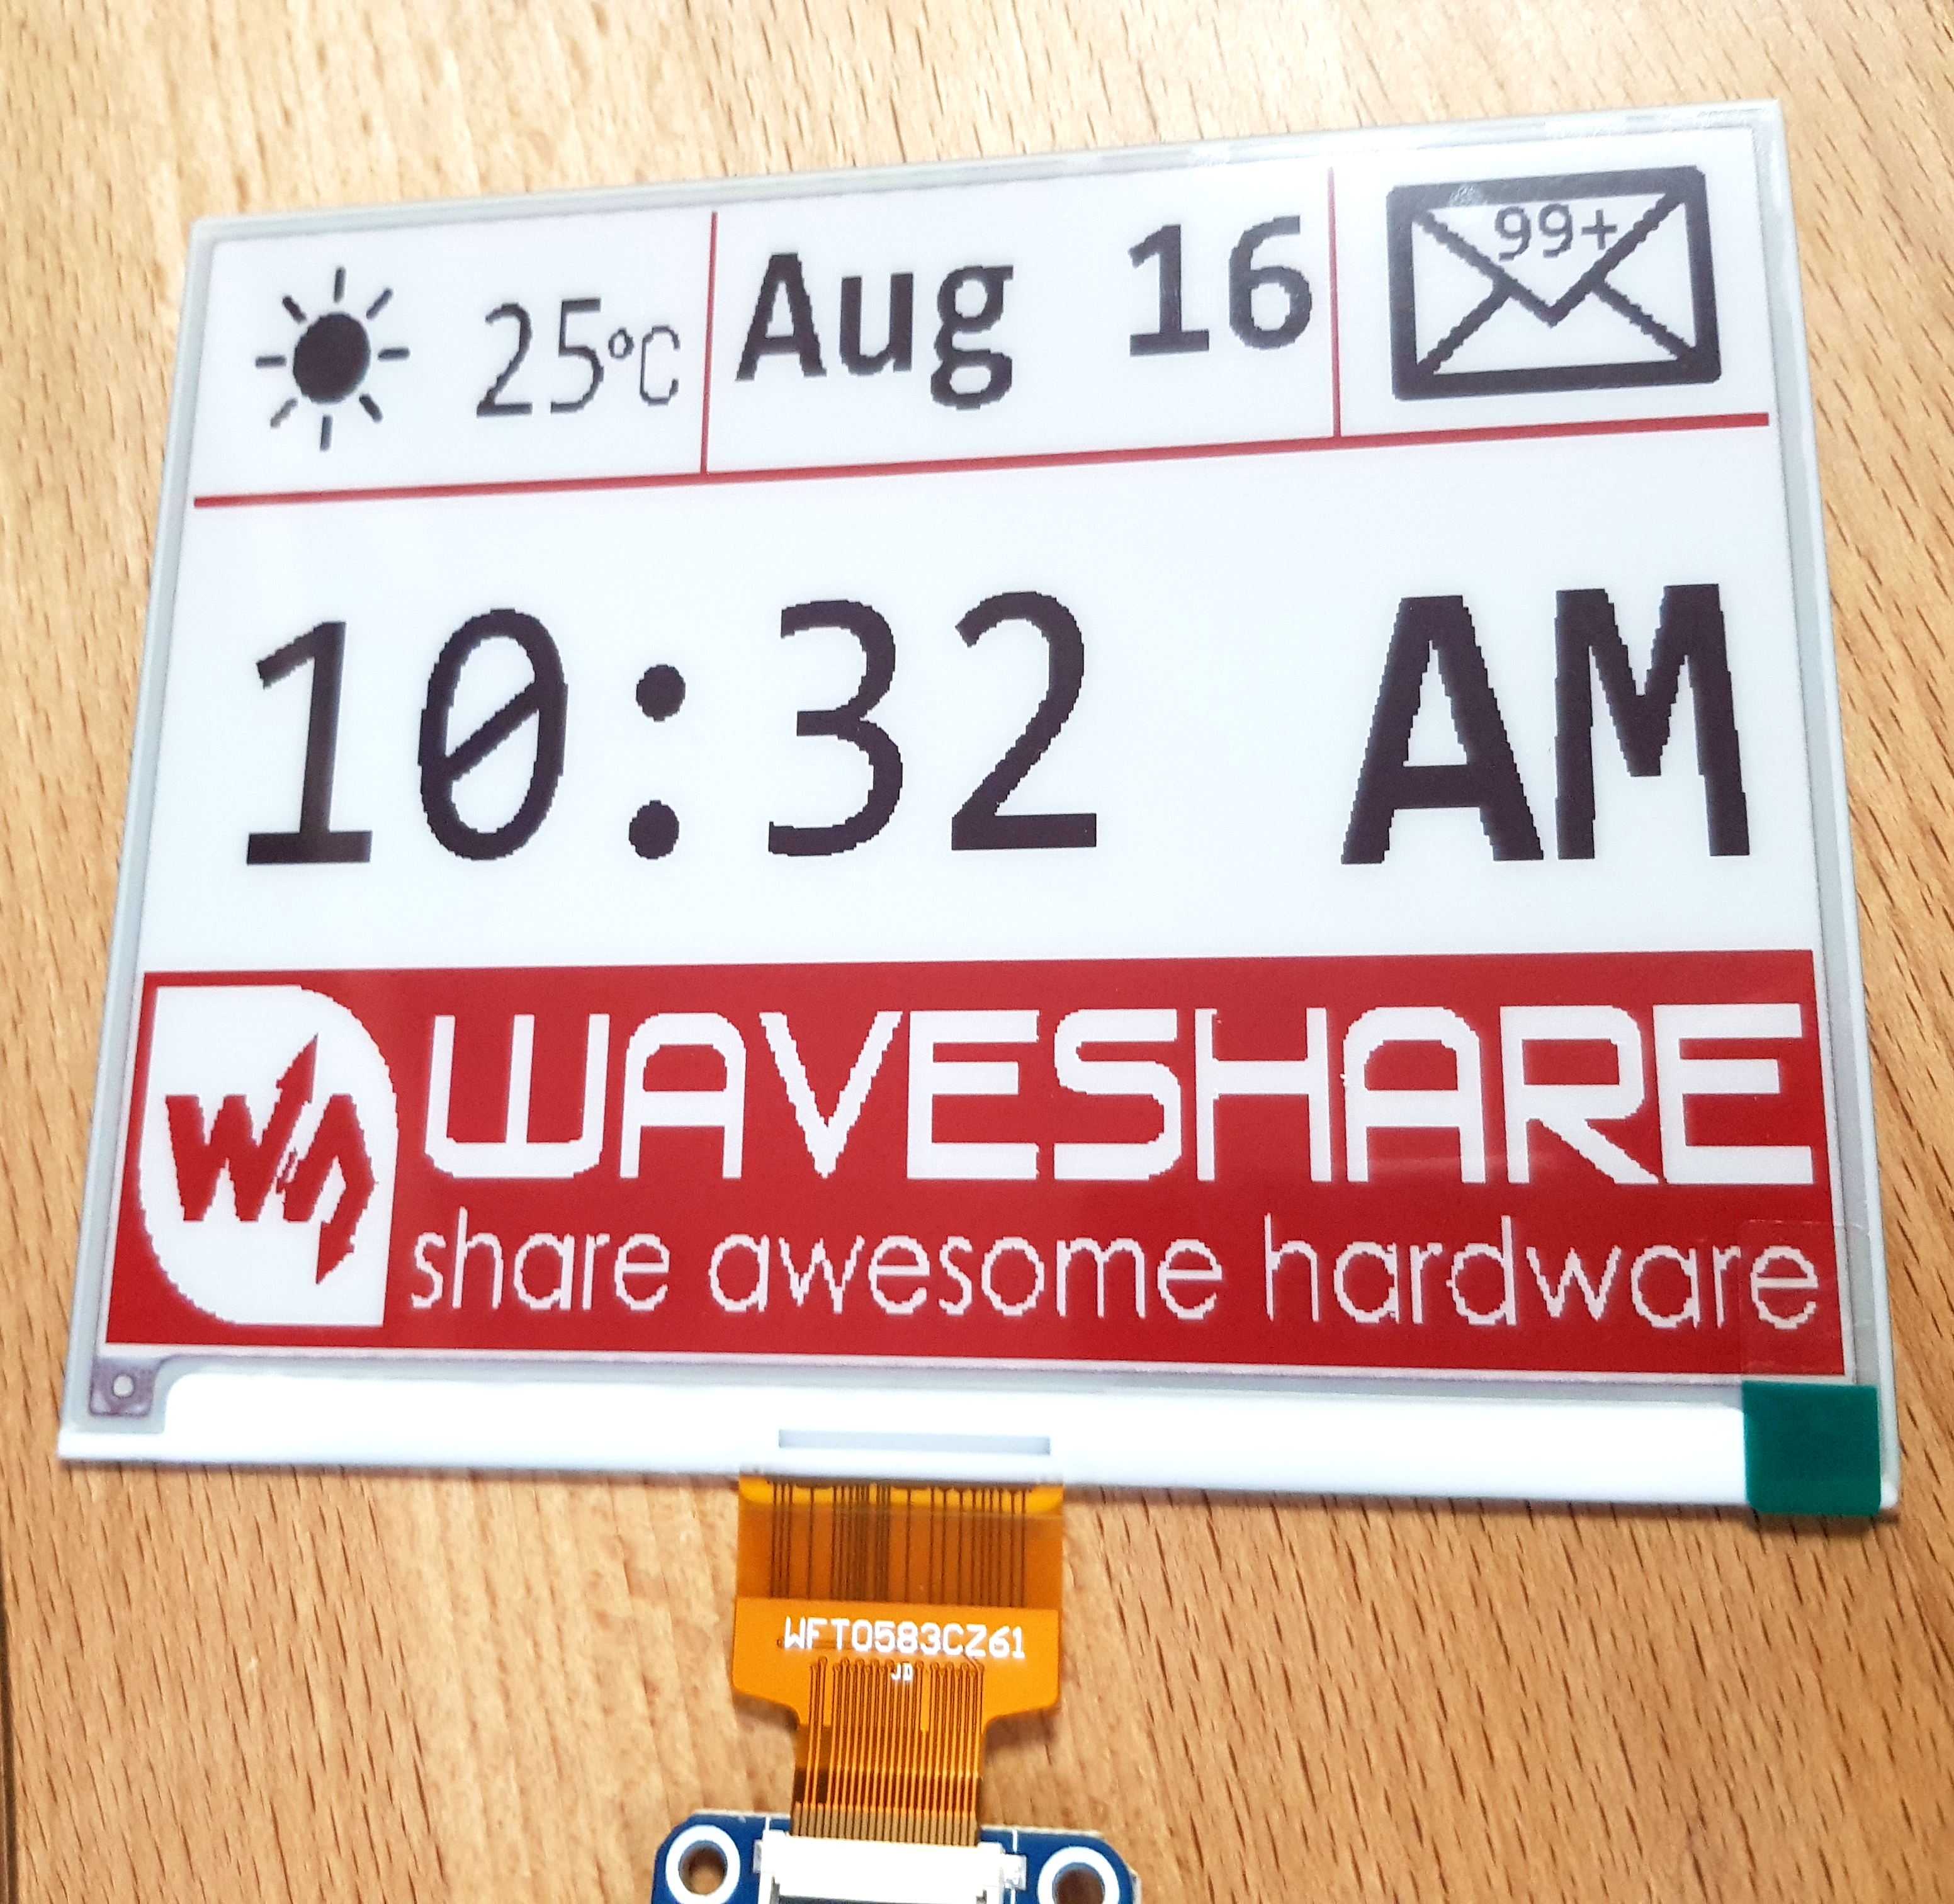
In the end it worked out fine and the EPDs was writeable, showing a simple logo:
In the beginning I was not exactly sure how the resistor on RESE pin has to be calculated, so I picked the 3 ? used in some hats for raspberry pi etc. As the used inductor is a bit high in resistance with its ~3.1 ?, the display didn’t update properly. It seemed to properly update the screen content, but in the end it only showed a color pattern noise.
The voltages being the first thing to check, it was obvious that the boost circuit isn’t able to create a stable voltage. I had to lower RESE down from 3 ? to 1.5 ? to get a properly updating EPD, then the 5.8″ EPD received a stable voltage. I guess the series resistance was too high to properly charge and discharge the coil and the boost efficiency went down. No proper voltage – no proper operation, that simple. Not sure what the exact effect of lowering this resistor is, but it seemed to work fine afterwards.
The GxEPD2 library doesn’t support that specific screen resolution out of the box. There was a simple solution: use the GxEPD2_750c_Z08 display and manually change line 23 in its header file fromstatic const uint16_t WIDTH = 800; to static const uint16_t WIDTH = 648;
The display controller seems to be compatible aside of a small issue. The partial update didn’t work. Maybe I am using the API incorrectly or there is a compatibility issue indeed. Still good enough for the first prototype.
Environment sensors
Being an environment sensor on its own, we could stop here already. But why not place one of those tiny BME280 to measure temperature and humidity as well? And while we are already adding stuff, the CCS811 VOC sensor doesn’t use too much PCB space either. The first revision of the PCB hosted them in the middle of the board, next to each other which was not a great idea. The ESP32’s temperature creeps over to the BME and also the CCS811 has an internal heater, negatively (or should I say positively?) influences the BME280’s temperature readings.
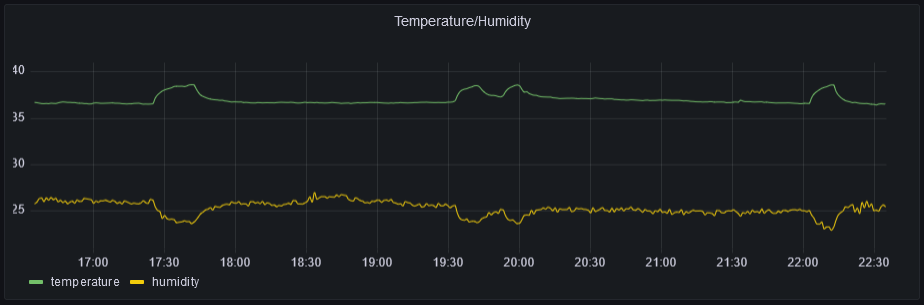
Realizing that there is a heater element in the CCS811, the second revision positions the BME280 (here as unpopulated U2) on a board cutout with thermal insulation. No ground planes, airgap and far away from any convection happening on the board.
When I get the sensors “in stock” again, I will populate them and hopefully the measured temperature is a lot more stable.
Connectivity
Okay, why do we choose an ESP32, if we don’t want fully IoT feeling with MQTT, grafana and push messages?
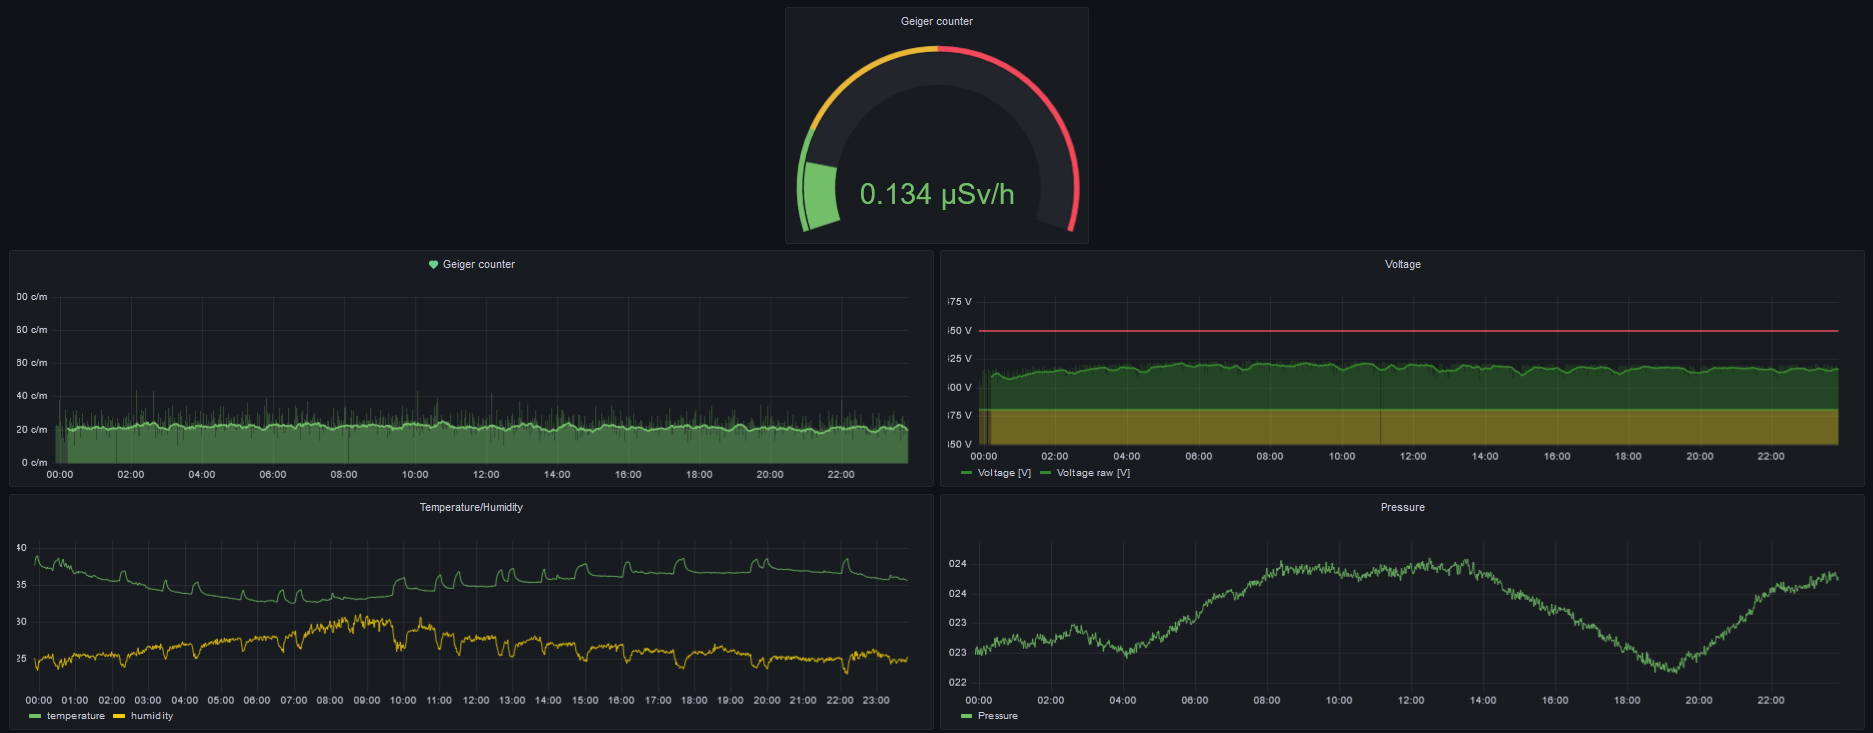
Of course we want that. The geiger counter collects the counts that happened within a minute and publishes that number via MQTT. Also the current environment sensor data and voltage measurement gets sent to the server.
On the server side, it goes it’s way through telegraf into influxdb as you would expect. The frontend is grafana and shows the measurements in a time series plot.
The result
Here a video showing how sensitive the tube is, teasing it with a piece of radioactive uranium glass, which you – funnily – can buy from handicraft stores online.
Bugs
Of course there were a few bugs. One caught me after three months of successful continuous operation. So the one mit the greatest impact (till now) was this one:
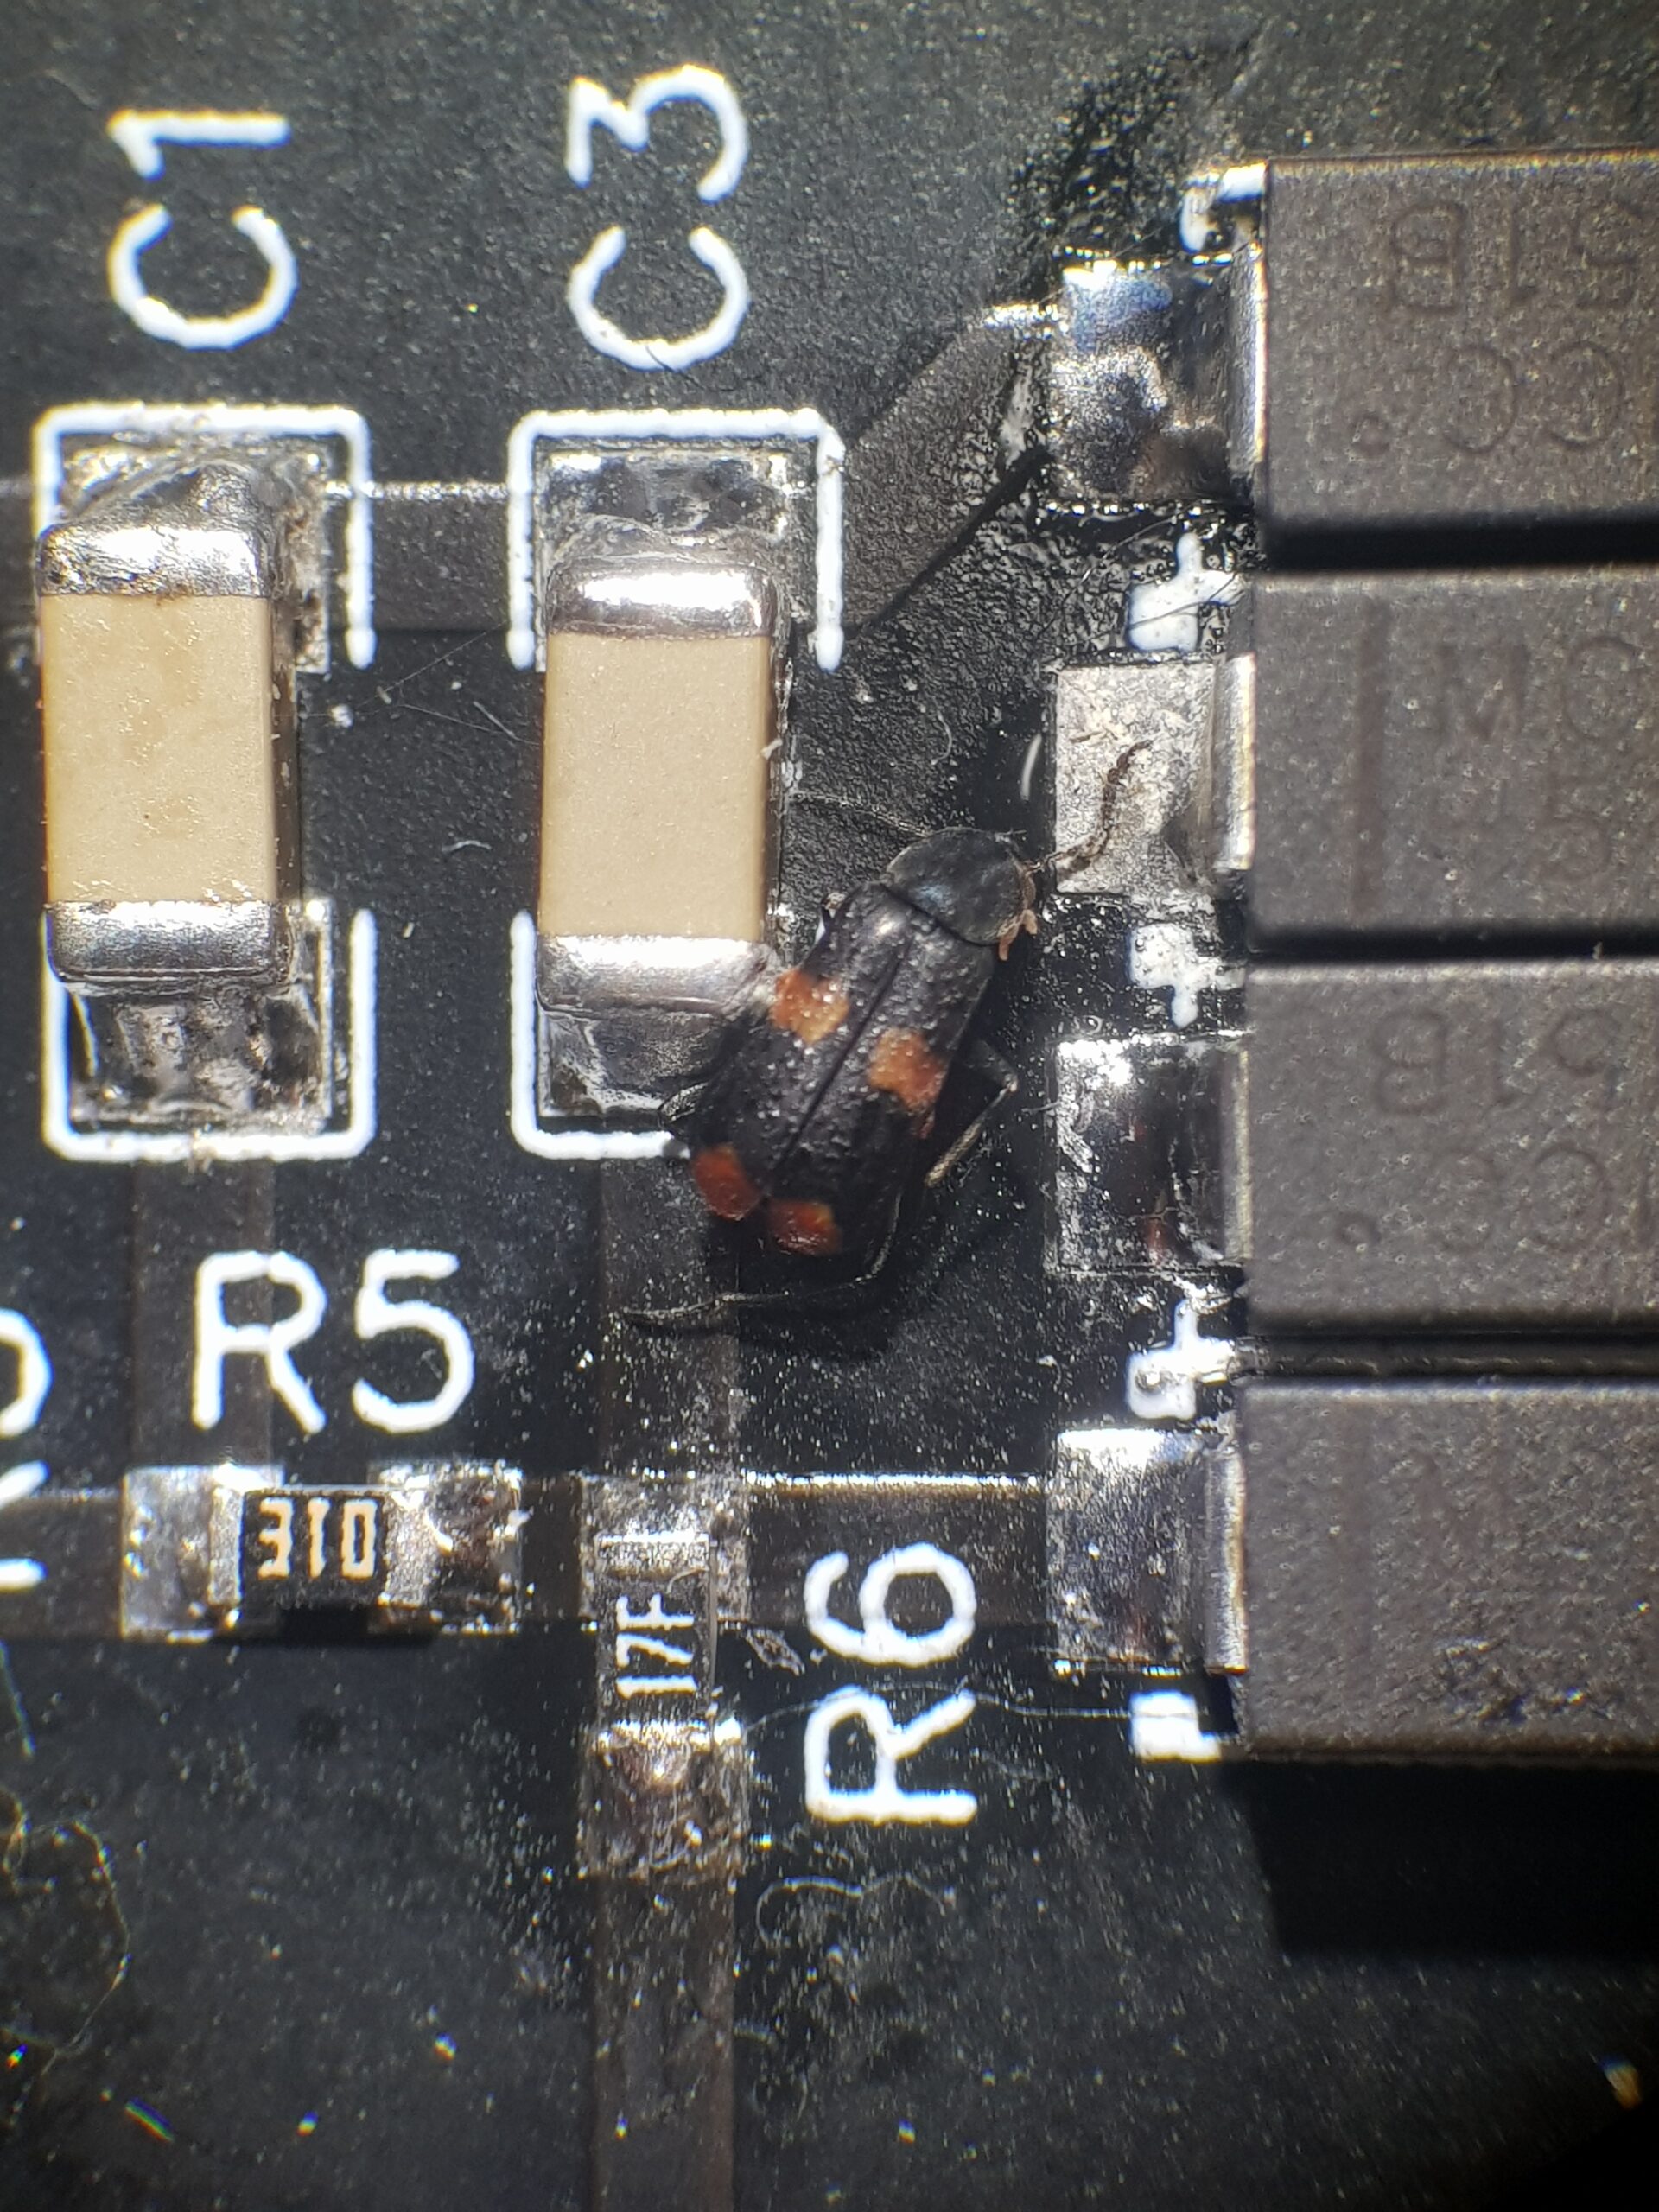
An obvious bug, causing a HV breakdown. Sorry, mate.
Conclusion
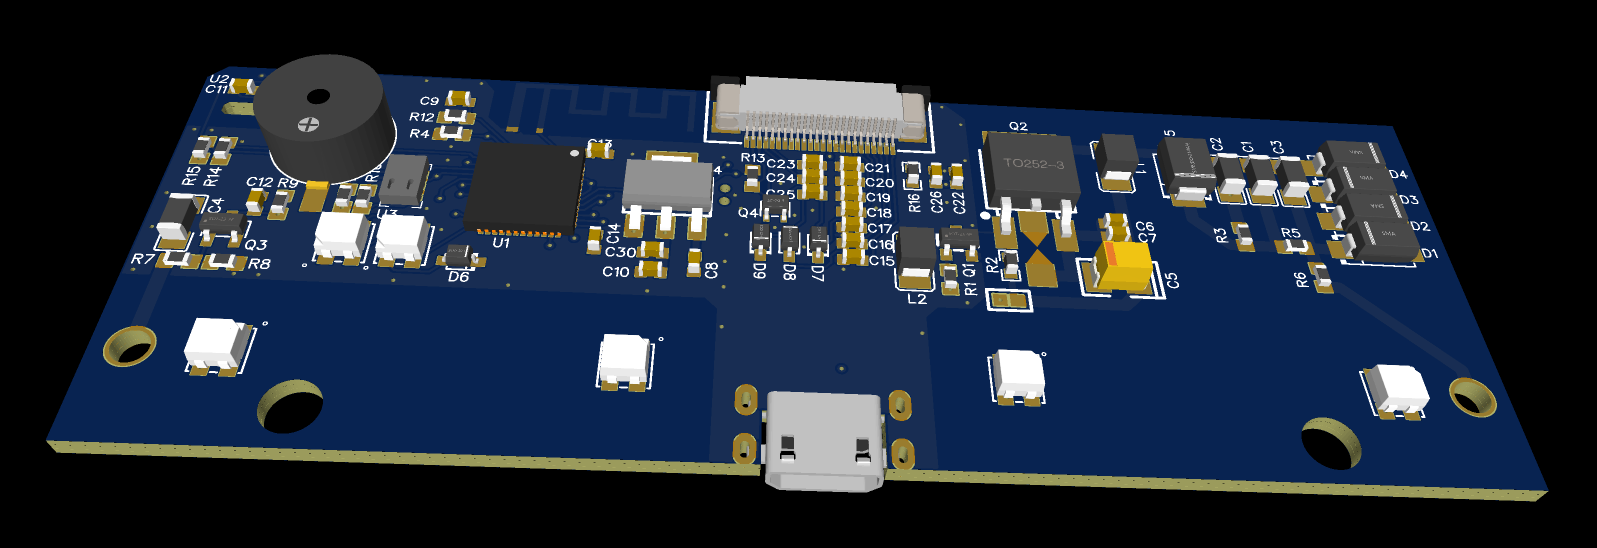
This PCB took three iterations, which is quite okay. Still didn’t order the third iteration, waiting for other ideas or improvements to come into my mind. Still some improvements to be done here and there, especially the EPD visualization is quite rough and the voltage controller isn’t implemented properly.
What also needs some more attention is the high voltage which is not very stable. Maybe I should pick the parts in the HV path with a bit more care. I tried to keep the leakage currenty low with bigger distances and no copper planes there, but there is still some leakage current. Maybe in the caps, but probably more likely the zener diodes.
Also the inductor resistance is something I will have to review. Hopefully LCSC has some better inductors available again soon.
Finally the result was absolutely appealing and fits my use case, having the counter in the attic, silently logging radiation levels.
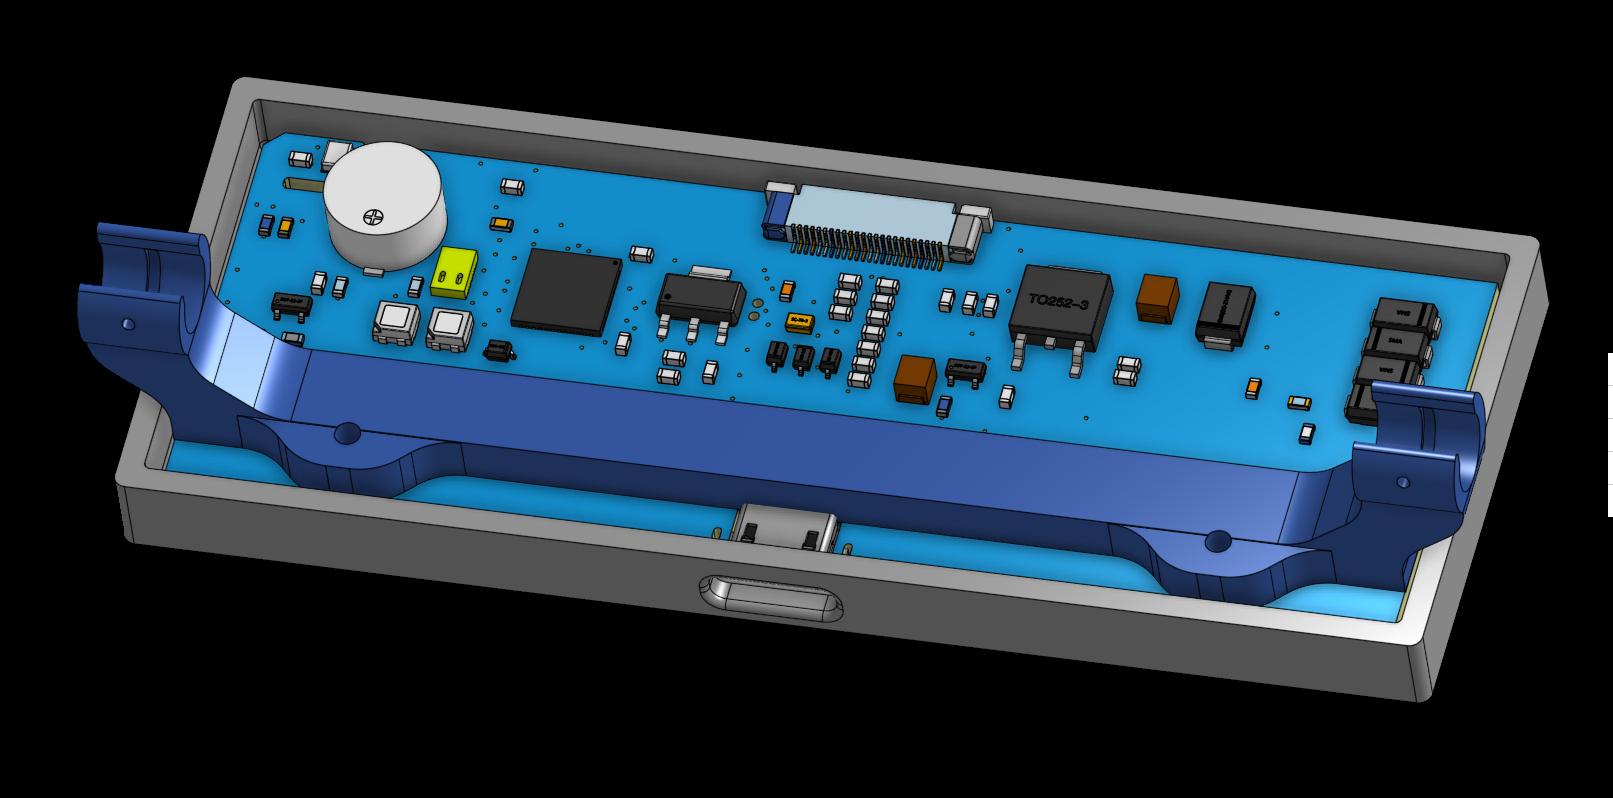
For my friends use case, the EPD code needs some updates and probably a small housing, but it’s close.
Sources
EasyEDA Schematic/Board: here
Sources: (not yet, coming later)
3D Design: here
Related Posts
Dyson v15 Battery Notes

ISO15693 Block for AARONIA RTSA-Suite