I made a custom LIBS software for analyzing spectral measurements.
But first of all – what is LIBS?
LIBS stands for Laser-Induced Breakdown Spectroscopy, which is in simple words: smashing a beam of photons into some material, leaving a crater and a glowing dust cloud (i.e. plasma) behind. By checking the color of the afterglow of that vaporized sample you can determine the atoms in it. That laser beam has just to have enough power that it charges the atoms of the sample material, smashing its electrons out, leaving a plasma behind. When they jump back into the ions, they happen to emit photons of specific colors.
There are definitely places in the internet that explain it a lot better of course.

But what do I have to do with that stuff? Well, nothing. There was just a guy on a german imageboard named Lorenz, who always posts or produces very interesting content, whom I offered help with his CCD-based project he once wrote about.
The Task
Somewhen that guy needed some support, having a very specific, timing-related issue with the TCD1304 / STM32F401 firmware he used. He already built a working spectrometer that did well for detecting spectra of continuous light sources, but the LIBS method requires some exact timing of the sensor shutter to not measure the massive laser blast pulse’s color, blinding out the sensor, but measuring the color of the afterglow only.
So he just needed a trigger input for the NUCLEO-F401RE board and its firmware to start sampling with some configurable delay of ~10 µs up to several ms. Of course this was not such a big issue and I customized the firmware quite quick, but testing around with the original software, I realized I wanted to make my own user interface for that setup.

Don’t get me wrong, that software is fit for its purpose, and even has some dark frame etc calibration features. But as the setup is meant for LIBS spectography and I wanted to add some other advanced features, I definitely wasn’t able to do with my python skills. So I started my own software for that project.
The delay was implemented in a very scientific way – just burn CPU cycles. Didn’t want to mess with timers and stuff, should be good enough for the task for now.
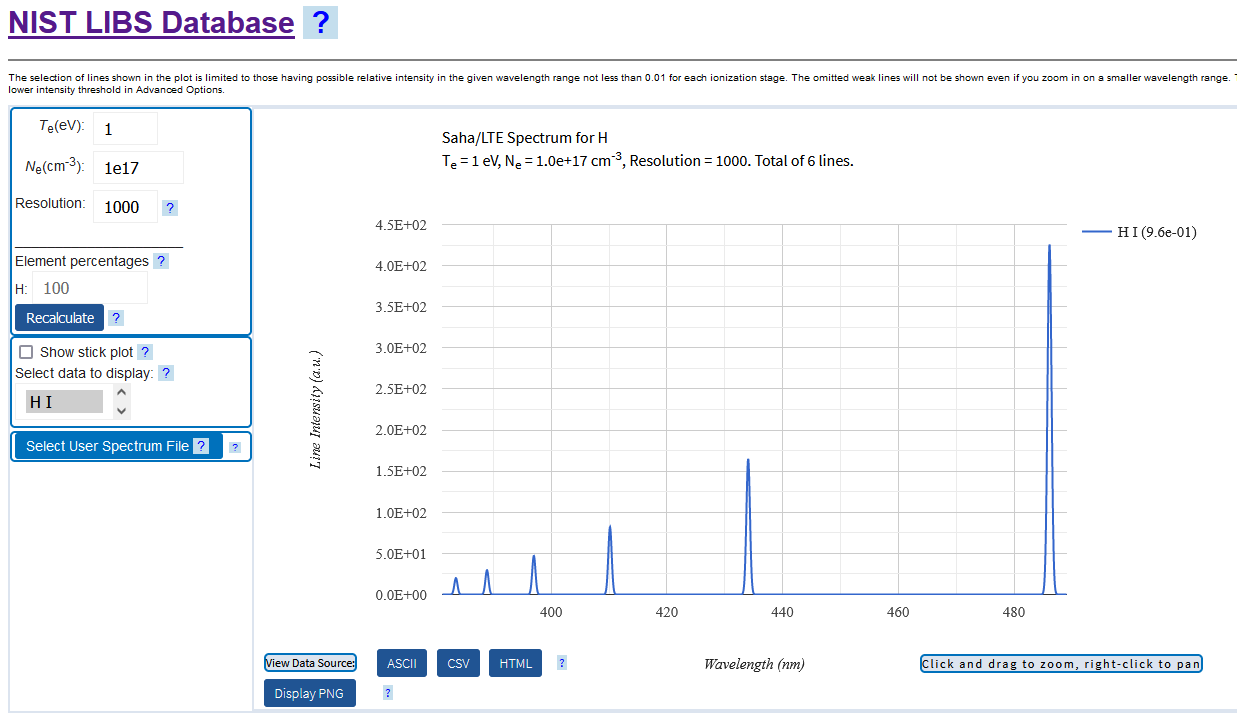
NIST LIBS Database
The NIST LIBS Database offers a lot of spectra of many chemical elements that we wanted to see in some software for overlaying the measured spectrum.
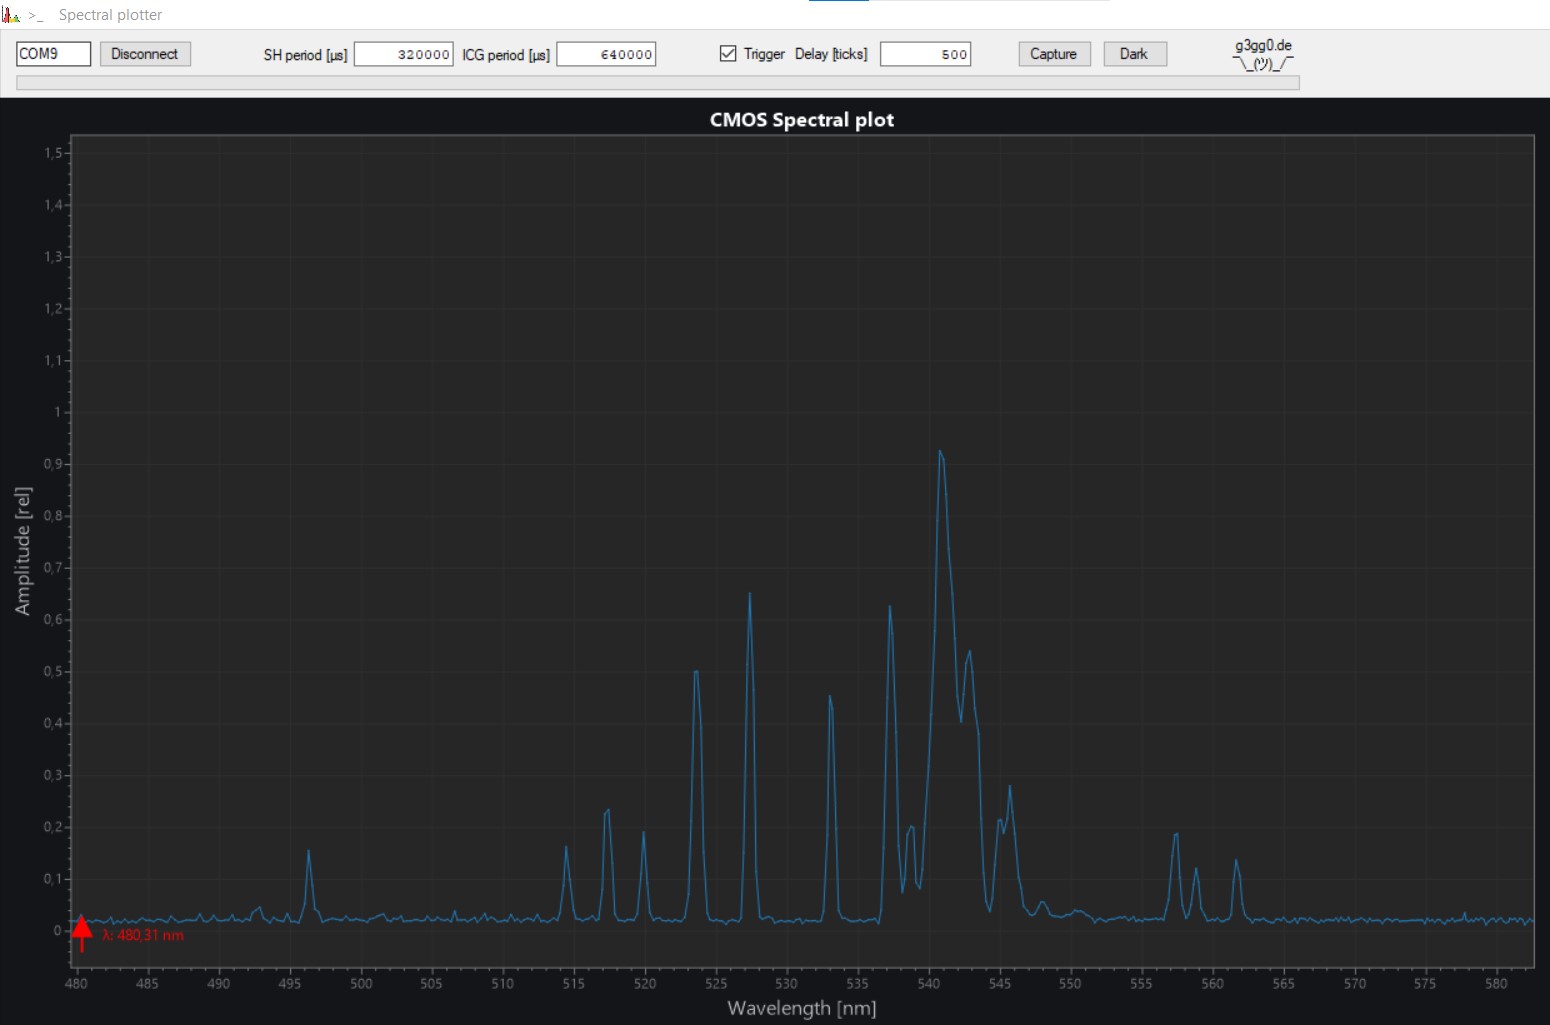
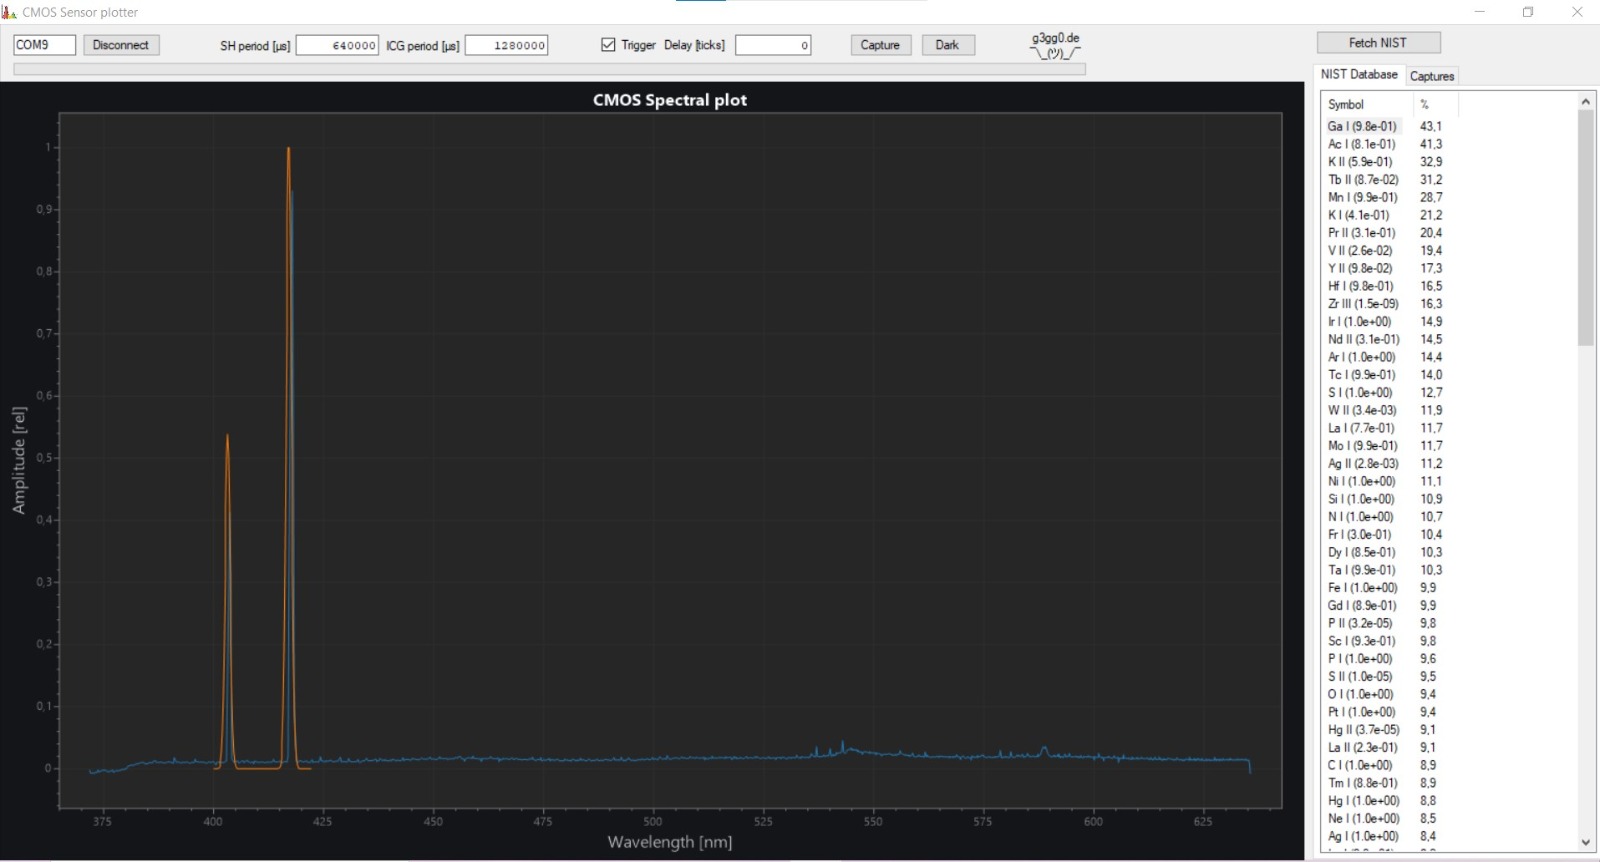
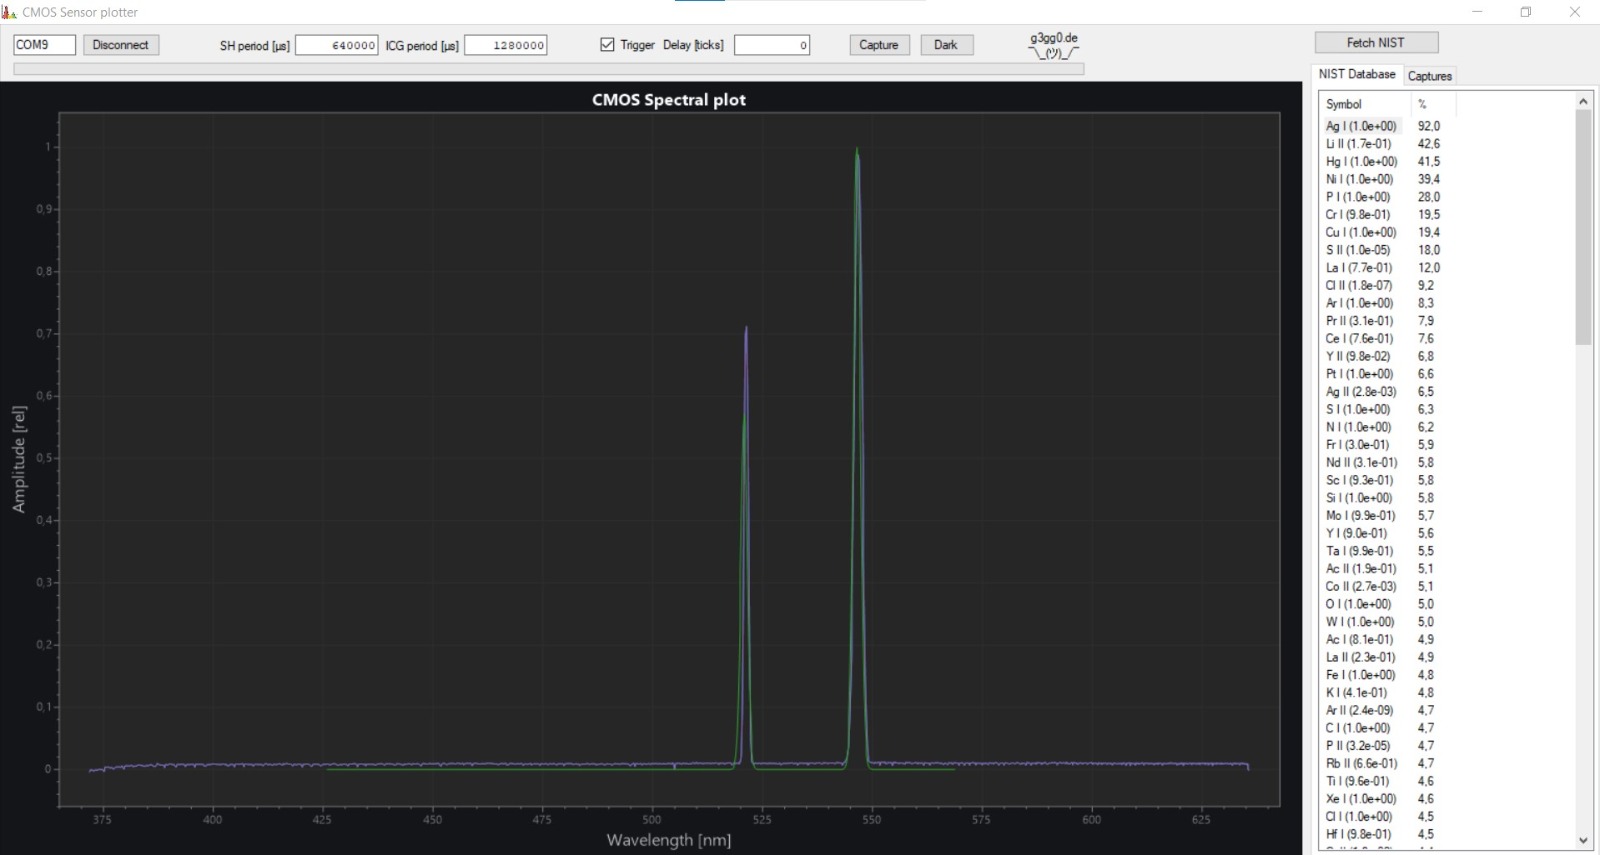
So I used my experience with a TCD132D where I visualized some other stuff already using ScottPlot, a great .NET visualizing library. Implementing the protocol of Esben Rossel’s firmware and visualizing the measured spectrum was not much of an effort. Soon there was some basic software, showing the color spectrum of the sample’s afterglow.
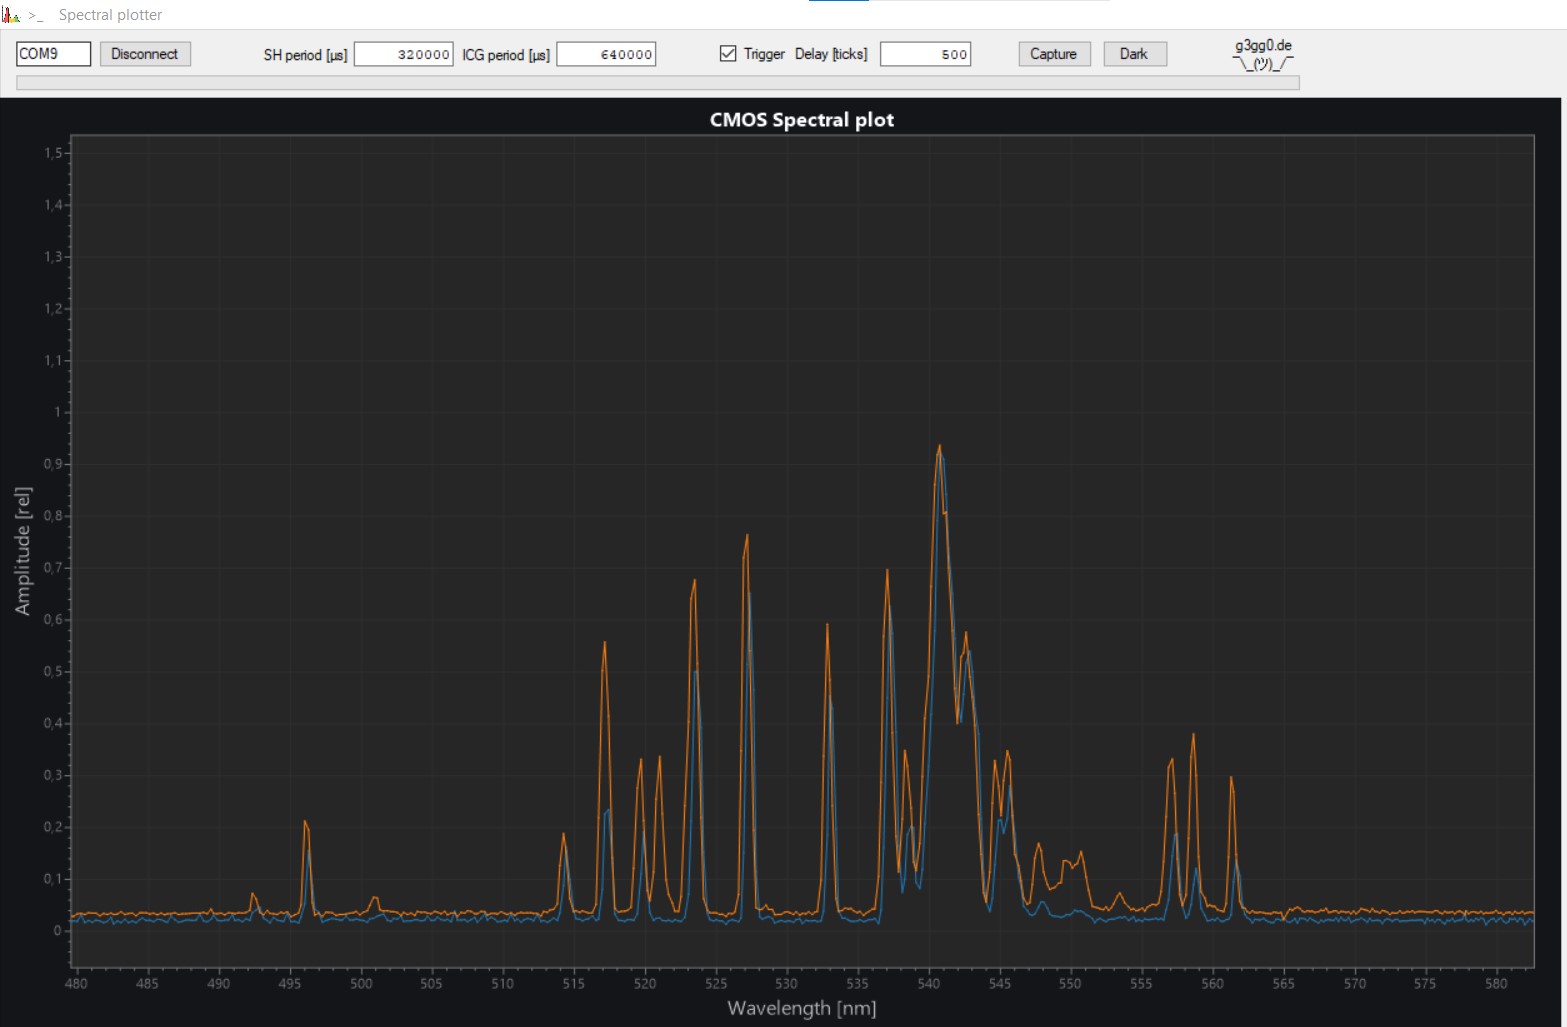
When looking at this plot, you cannot make out which elements you expect to have in the sample. Thats where I made a fetcher module, that retrieves the (…sorry, NIST guys…) ugly “embedded JavaScript table” of the spectrum from the HTML data of the NIST Database page. I am sure the NIST guys have the data in proper formats on server side, but they bake it into the HTML page where it is annyoing to extract. Maybe they do that intentionally to prevent people like me using their databases as a source :)
Anyways, hours of extracting JS from HTML pages and parsing JS data for saving it as JSON later, we finally were able to show different element’s spectra over the measured plot.
Autodetection, the tinkerer’s way
A few hours more of experimenting, I was able to add an “autodetect” feature which tries to find the best match for the given spectrum. It simply multiplies the delta between the sample and the reference and squares it. As the sample could potentially be impure and contain traces of other elements, I saturate it towards zero, that there is no penalty for spectrum lines that come from contaminants.
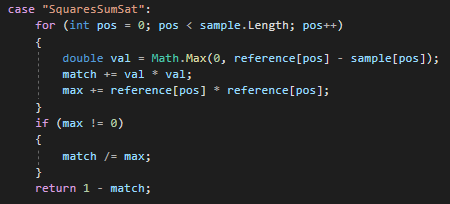
Showing all the match quotas for all the the elements from the NIST database, should give you the “best match” on top, helping you to identify your sample.
This autodetection works quite well for pure samples, but this is just a very experimental code and by far not comparable with commercial products of course. It would be really interesting how they match the spectral lines. Or is there a better way to match the curves?
Sensor calibration
To be able to calibrate the sensor, there are three features:
- the first one is the Dark frame button to capture a spectrum with the sensor dark currents. That is in other words to detect what the black value of a pixel will be. Depending on temperature and the analog path, this may vary over time.
- the next feature is a polynomial to map pixel numbers to specific wavelengths. To make this easier, there is a menu to do that by clicking and adding reference points. So you can e.g. sample gallium and click on the specific spectral line at around 403nm and tell “that must be 403nm” (see the video below). Then repeat it for multiple elements, or shine with different lasers onto the sensor. In a perfect world, this should be just scaling and offset, but depending on various factors there could be some nonlinearity you can fix using a polynomial.
- finally there is a polynomial to correct brightness depending on the wavelength which is only available in the .json config file. This will compensate for the sensor not being sensitive equally over the whole spectrum. Unfortunately that is a lot harder to tune in.
Sources
SpectrumPlotter: https://github.com/g3gg0/SpectrumPlotter
STM32 Firmware: https://github.com/g3gg0/tcd1304-advanced (based on this one)
Conclusion
All of this was just a few days of work, it turned out very practical if you happen to have a LIBS setup in your basement. I don’t have one, but it was fun to see it in action remotely and having a joint work of a software and hardware team with Lorenz :)
You should definitely check the youtube channel of Lorenz who made a great video, showing you his setup and how the software works. Also check his other videos, there is a lot one can learn.
I absolutely enjoyed digging into that stuff and if you find it useful, send me a mail or comment the video or this post.
Related Posts
Dyson v15 Battery Notes
ISO15693 Block for AARONIA RTSA-Suite